NGO Another Way (Stichting Bakens
Verzet), 1018 AM
SELF-FINANCING,
ECOLOGICAL, SUSTAINABLE, LOCAL INTEGRATED DEVELOPMENT PROJECTS FOR THE WORLD’S
POOR
|
FREE
E-COURSE FOR DIPLOMA IN INTEGRATED DEVELOPMENT |
|||||
Edition 01 :22 July, 2013.
(VERSION EN FRANÇAIS PAS DISPONIBLE)
Summaries of
monetary reform papers by L.F. Manning published at http://www.integrateddevelopment.org.
Chicago Plan Revisited Version II: An insufficient
response to financial system failure. (Posted 11 May, 2013.)
Comments on the (Jaromir Benes and Michael Kumhof) Chicago Plan Revisited Paper.
Debt bubbles cannot be popped : Business cycles are policy inventions.
DNA of the debt-based economy.
General summary of all papers
published.(Revised
edition).
How to create stable financial systems in four
complementary steps. (Revised edition).
How to introduce an e-money financed virtual minimum wage
system in New Zealand. (Revised edition) .
How
to introduce a guaranteed minimum income in New Zealand. (Revised edition).
Interest-bearing debt system and its economic impacts.
(Revised edition).
Manifesto of 95 principles of the debt-based economy.
Manning plan for permanent debt reduction in the national economy.
Missing links between growth, saving, deposits and
GDP.
Measuring Nothing on the Road to Nowhere : The Myths of Inflation and
Growth Measurement.
Savings Myth. (Revised edition).
There’s no such thing as affordable housing.
Unified text of the manifesto of the debt-based
economy.
Using a foreign transactions surcharge (FTS) to manage the
exchange rate.
(The
following items have not been revised. They show the historic development of
the work. )
Financial system mechanics explained for the first time. “The Ripple
Starts Here.”
Short summary of the paper The Ripple Starts Here.
Financial system mechanics: Power-point presentation.
![]()
This
work is licensed under a Creative
Commons Attribution-Non-commercial-Share Alike 3.0 Licence
DEBT
BUBBLES CANNOT BE POPPED:
BUSINESS
CYCLES ARE POLICY INVENTIONS.
By
Sustento Institute,
Version 3 for distribution.
18 July 2013, 3000 words.
EXECUTIVE SUMMARY.
Figure 1 : Model systemic
inflation v. GDP : New Zealand 1968-2013.
Figure 2 : Debt Model and
Bubble Size for New Zealand 1978-2013.
Figure 3 : Systemic inflation
and GDP growth in New Zealand 1986-2013.
Attempts to deflate debt
bubbles deflate the economy not the bubbles.
Not even the Great Depression
of the 1930’s destroyed all the debt that had built up prior to the worldwide
crash. Nor has the present “Global Financial Crisis” deflated the current debt
mountain. The debt mountain has instead increased in the
Bubbles are largely a figment
of macroeconomic imagination. Just like business cycles. Wrecking the world
economy to de-leverage structural debt is like trying to shovel lava from an
erupting volcano.
This article traces the origin
and growth of exponential debt growth, bubbles and business cycles.
In the absence of structural
financial reform orthodox economic theories and policies cannot stop the
impending implosion of the world financial system because they do not offer a
mechanism for appropriate macroeconomic action.
INTRODUCTION.
There is a long history of
attempts to explain business cycles and debt bubbles. The economists involved
include a who’s who of the world’s most prominent academics that is far too
long to list here.
From Irving Fisher’s
“The Debt-Deflation
Theory of Great Depressions” of
1933, to Hyman Minsky’s “ The Financial Instablility Hypothesis” of
1992, many of those writers have
recognized that business cycles and bubbles relate to changes of ....surprise, surprise ...... debt. For example, as long ago as 1951 Arthur Burns
wrote:
“The
problem of how business cycles come about is therefore inseparable from the
problem of how a capitalist economy functions.” (A. F. Burns,
in Wesley C. Mitchell, What happens during business cycles: A progress
report.
Despite the mountains of
learned work over more than half a century since that was written, nobody until
now has properly described “how
a capitalist economy functions” even though the underlying
mechanisms have been staring the world in the face all along.
This article refers
to a debt model of the economy that “connects the dots” to demonstrate the
mechanics of the debt-based financial system.
The model is used
first to discuss what “bubbles” really are, and then to show how macroeconomic
policy itself creates business cycles in a futile attempt to “manage” systemic
debt growth and inflation.
Finally the article
considers the consequences to the world financial system as it becomes
saturated with systemic inflation arising from the exponential increase of
interest-bearing debt.
THE DEBT MODEL.
The author’s debt model of the
economy is most recently summarised in a paper “Measuring Nothing on the Road to Nowhere : The Myths of
Inflation and Growth Measurement.”
In contrast to orthodox
economic work, the author’s modified Fisher Equation of exchange fully
satisfies the basic accounting equation, which is : Assets=Liabilities + Net Worth.
For the M3 banking
institutions and the central bank , the basic accounting equation is expressed
as DC+Dnfca = M3+ R.
DCm
=(GDP)/Vy +Ms +Dni +Db+R - Dnfcb +Nb (1)
Where:
DC = Domestic Credit.
DCm = Domestic Credit plus secondary debt Nb borrowed through
non-bank lending institutions (NBLI).
GDP/Vy = The
debt and cash used to create GDP (Dmy= Dmt+M0y).
GDP = Gross Domestic Product.
Vy = The speed of circulation
of productive transaction accounts.
Dmy = The productive transaction
account balance used to generate GDP.
Dmt = The portion of Dmy
arising from bank debt.
Dni = Debt
supporting non-inflationary economic growth.
M0y = The portion of Dmy contributing
to the non-inflationary cash transactions M0y * Vy
included in GDP.
Ms = Accumulated systemic
inflation arising from net after tax deposit interest paid on the total system
debt DCm .
Dnfca = Net foreign currency assets
(NFCA) resulting from the current account and capital transfers from the rest
of the world.
Db = Bubble debt (debt in
excess of the systemic debt requirements).
R = Bank residual retained profits and paid up
share capital not being part of the money supply M3.
Nb =
Secondary non-bank debt.
Surprisingly, this is the only
model of the debt-based economy that fully satisfies the basic financial
accounting equation, though some other economists like Steve Keen in
The unique features of the debt
model are that:
(a) It
separates the debt needed to fund the productive economy (GDP)/Vy from the remaining terms on the right hand side of
equation (1) that together make up the investment sector of the economy, and
(b) It separates the exponential
systemic inflation component Ms from the other investment sector
terms on the right hand side of equation (1).
Only a small amount of debt is used to physically
generate the economic output GDP. In developed economies, the investment sector
funding is dominated by the systemic inflation component Ms which
itself depends on the existing debt level and the interest rate paid on
deposits. Since the investment sector itself does not produce any goods and services
that contribute to GDP other than taxable services like brokerage and
consultancy provided by financial sector service companies, Ms must
be wholly funded by the productive economy through inflation in the productive
sector.
Ms funding creates an
exponential feedback loop that cannot be stopped unless the interest rate on
deposits is reduced to zero.
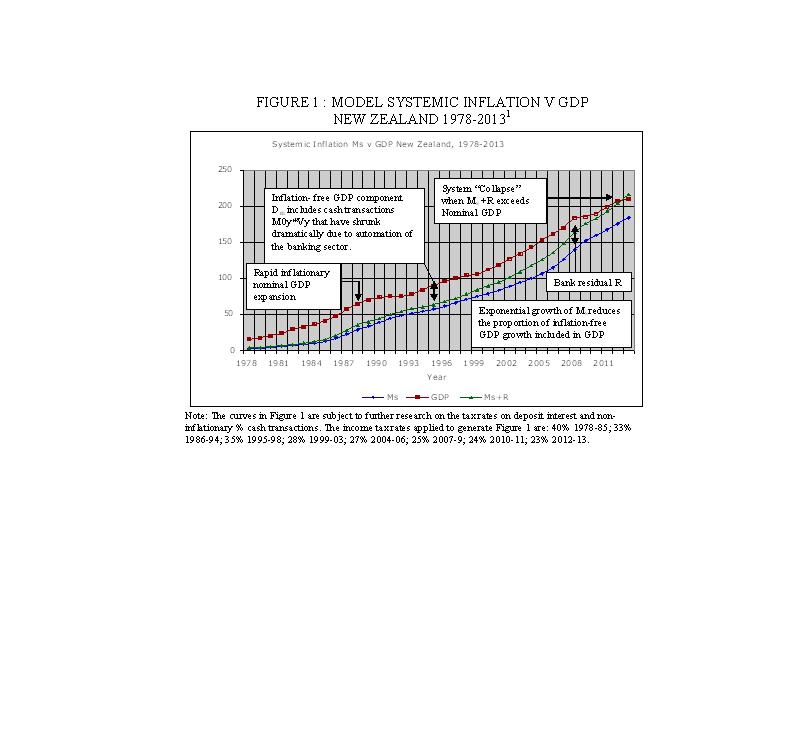
Figure 1 : Model systemic
inflation v. GDP : New Zealand 1968-2013.
Figure 1 plots the components of GDP
shown in equation (2).
GDP = Ms+ Dni+R (2)
Figure
1 shows that accumulated non-inflationary GDP growth Dni has all-but
disappeared in
Figure 1 shows that systemic inflation increased by NZ$150 billion
between 1988 and 2013 while nominal GDP increased by NZ$140 billion over the
same period. The systemic inflation Ms curve closely follows the GDP
curve. All
There has been no “real” GDP increase in
The recent debt de-leveraging
in 2009 and 2010 has made the situation worse, not better, just as it did
following the 1987 share market crash. The two events can be seen clearly in Figure
1 for 1987 (spike in inflation) and Figure 2 (below) for 2007 (spike in bubble
debt Db).
Equation
(2) is derived in the “Measuring Nothing on the Road to Nowhere : The Myths of Inflation and
Growth Measurement.”
While some of the capital
investment supporting the productive sector has been destroyed through debt
default in recessions like those of the early 1990’s and 2009-2010, Ms
continued to expand, as it must do as long as deposit interest rates exceed
zero. Orthodox measurements of “growth” and “inflation” entirely miss the
crucial structural processes taking place in the debt-based economy. For more
information refer to the DNA of the debt-based economy which shows that in a debt based financial system GDP equals the outstanding
principal on capital investment.
BUBBLES.
Bubbles evolve when banks
create and lend more debt than the financial system needs. It really is that
simple, despite a century of misplaced research.
The bubble debt can be easily
calculated by solving equation (1) for Db since all the other terms
are either known or can be independently calculated. To get the bubble size Bu,
the secondary debt Nb has to be added onto Db in Figure
2.
That
equation is: M3= (Dmy+Ms+Dni+Db).
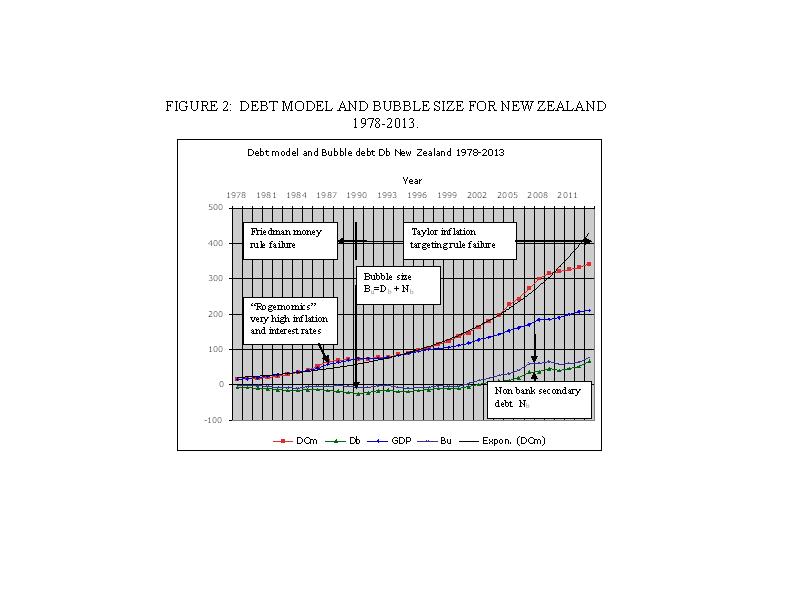
The bubble history for
Figure 2 : Debt Model and
Bubble Size for New Zealand 1978-2013.
Figure
2 is plotted for DCm (=DC+Nb) whereas Db is calculated from M3
that does not include
The two major
In the lead up to the 1987
share market crash, policy was guided by the Friedman money rule that allowed
the money supply to expand to match nominal GDP growth. The high inflation that
resulted from the monetary policy was accompanied by substantial “real”
economic growth as it is currently measured under the current System of
National Accounts (SNA). That is clearly shown by the increase in Dni
(refer to the text box in Figure 1). Interest rates were
progressively increased to try to manage the debt expansion, generating even
more systemic inflation Ms. Debt continued to expand until the
productive sector could no longer fund the escalating share prices in the
investment sector. Share prices collapsed because investors’ profit growth
expectations could no longer be satisfied. Many highly leveraged businesses
failed, including (in
Following the 1987 collapse,
orthodox macroeconomic policy was switched from targeting the money supply
following the Friedman money rule to inflation targeting following a
Higher interest rates increase systemic inflation instead of reducing
it.
The demand for new debt then falls but the need for new debt
rises because debt servicing costs in the productive sector increase.
When inflation targeting imposed rising interest rates in
The
In the present financial system debt de-leveraging typically “hits” the
banking sector first, rendering it quickly insolvent as happened in the
The
The recent primary over-funding of debt since 2002 shown in Figure 2 as
the bubble size Bu in
BUSINESS CYCLES.
Business cycles are similar to bubbles except that they are typically of
shorter duration and they are non-structural, being caused directly by the
application of very poor macroeconomic policy options, especially inflation
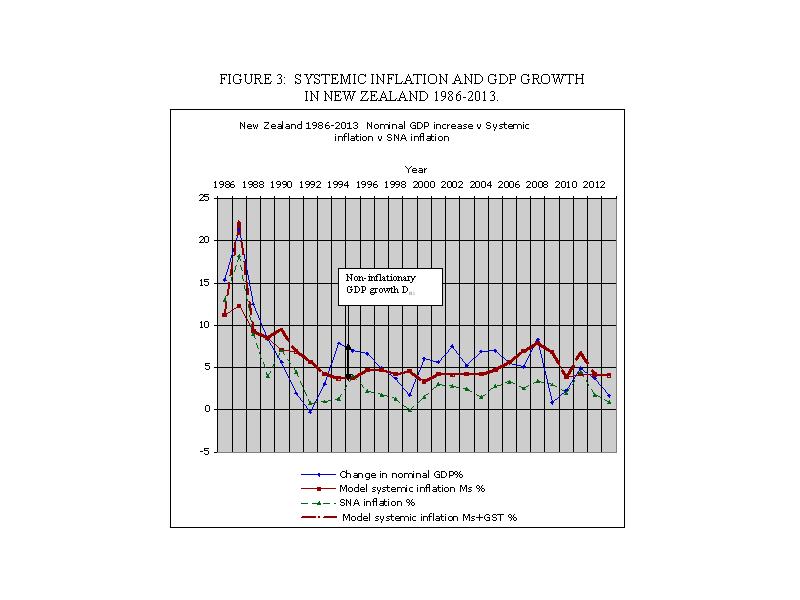
targeting that has continually suppressed “real” economic growth (Dni).
No sooner than non-inflationary growth Dni has got started, it has
been destroyed by flawed central bank monetary policy as can be seen in Figure
3.
As shown in “Measuring Nothing on the Road to
Nowhere : The Myths of Inflation and Growth Measurement” the use of CPI inflation as the trigger for
interest-rate intervention is not only wildly mis-measured, it bears no
relation to the structural exponential systemic inflation occurring in the
economy. Astonishingly, interest costs are not included in the CPI, so
the effects of interest rate changes are not taken into account when monetary
policy is used to “control inflation”. In
Lower systemic inflation would mean that available productive resources
could be utilised better. More “growth” could occur simply because income
earners would keep more of their incomes. There are no complex theories or
equations involved.
Figure
3 : Systemic inflation and GDP growth in New Zealand 1986-2013.
The business cycle comprises the following sequence:
(a) Since all debt must be
funded from the productive economy, higher interest rates increase the gross unearned
income of deposit holders while reducing aggregate disposable incomes in the
productive sector by the same amount.
(b) Reduced incomes in the
productive sector lead to reduced demand (consumption) there, higher
unemployment, and default on household and business debt.
(c) At the same time, those
same households and businesses are forced to take on yet more Ms
debt to fund higher systemic inflation created by the higher interest rates. That is a classic “double hit” on the productive
sector.
(d) The government receives more taxation from the higher taxes it receives
on unearned income but that extra tax is offset by lower business profits that
reduce the government’s company tax receipts. The government also has to “pick
up the pieces” as unemployment and associated social transfer costs rise.
(e) When households and
businesses cannot take on more debt some of them default, slightly reducing the
rate of increase of total debt DCm. Some of the vast majority who do
not default choose to repay debt instead of consuming. Others try to “save” by
hoarding part of their incomes and reducing their consumption that way.
(f) Nominal GDP increases
below systemic inflation indicate a recession because existing income, and
therefore GDP, is given up to fund the systemic inflation as consumption falls.
(g) There is a cascade effect
on GDP as consumer demand falls, forcing the remaining players in the
productive economy to discount prices and profits.
(h) As the measured (but
wrongly calculated) CPI inflation falls toward the lower end of the inflation
target range, the monetary authorities reduce interest rates.
(i) Disposable incomes begin
to rise because the rate of change in Ms falls. Households and firms
then have more to spend. Some save or continue repaying debt, slowing the
recovery process.
(j) GDP growth in excess of
systemic inflation is “real” (Dni) growth.
(k) There is no inflation targeting for the investment sector so there are
no controls on debt growth there.
Contrary to orthodox economic
theory, the debt model shows there are no multipliers in macroeconomics. The
basic financial accounting equation is a one to one relationship between
financial assets on the one hand and financial liabilities on the other hand.
Inflation targeting and other applications of orthodox macroeconomic
policy destroy inflation-free GDP while increasing systemic inflation.
LIVING
WITH THE CONSEQUENCES OF SYSTEMIC INFLATION.
When nominal GDP and Ms
grow at the same rate the investment sector expands at the same rate as the
productive economy and there can be no economic “growth” (Figure 1).
When Ms increases
faster than nominal GDP, (Dni + R) must fall as shown in equation (2).
GDP = Ms+ Dni+R (2)
Since the banks will not give
up their residual R except in the case of debt default by their clients, the
debt supporting non-inflationary growth (Dni) mathematically must
shrink when Ms growth is greater than the change in the measured CPI
inflation included in nominal GDP. This can be clearly seen in both
As Dni falls towards zero, earlier inflation-free gains in GDP
are lost to the systemic inflation that orthodox economics has failed to
measure, as shown for
Businesses and income earners
are no better off in real terms than they were before the Friedman money rule
and
In
The vast majority of people,
“the 99%”, are financially worse off now in terms of their real purchasing
power and quality of life than they were decades ago.
That is why most households must have two incomes to make ends meet and
why so many people cannot “afford” their own home.
Chaos erupts once Dni has been reduced to zero because the
banking system then fails as R is also (quickly) eroded toward zero through
debt default.
When that happens the monetary authorities have no choice but to “bail
out” the banks by creating some form of interest-free money. That is exactly
what has happened in
To avoid global system failure the financial system must be
comprehensively restructured to eliminate systemic inflation as far as is
possible[1].
In the interim, increases in Ms must be slowed or stopped so
that non-inflationary “growth” can resume. And that, again, is what has
happened in
There is chaos in countries like
The “impossible” in this context is to try to offset ongoing Ms
growth greater than GDP growth against the GDP itself.
According to the author’s debt model that is a theoretical impossibility
because it causes a systemic economic collapse that cannot be corrected without
fundamental reform first of all to reduce the growth of Ms to close
to zero and secondly to control the issue of new credit to avoid bubble
formation.
Lowell Manning 18/7/13
Summaries of monetary reform
papers by L.F. Manning published at http://www.integrateddevelopment.org.
Chicago Plan Revisited Version II: An insufficient
response to financial system failure. (Posted 11 May, 2013.)
Comments on the IMF (Benes and Kumhof) paper “The
Chicago Plan Revisited”.
Debt bubbles cannot be popped : Business cycles are policy inventions.
DNA of the debt-based economy.
General summary of all papers
published.(Revised
edition).
How to create stable financial systems in four
complementary steps. (Revised edition).
How to introduce an e-money financed virtual minimum wage
system in New Zealand. (Revised edition) .
How
to introduce a guaranteed minimum income in New Zealand. (Revised edition).
Interest-bearing debt system and its economic impacts.
(Revised edition).
Manifesto of 95 principles of the debt-based economy.
The Manning plan for permanent debt reduction in the national economy.
Measuring Nothing on the Road to Nowhere : The Myths of Inflation and
Growth Measurement.
Missing links between growth, saving, deposits and
GDP.
Savings Myth. (Revised edition).
Unified text of the manifesto of the debt-based
economy.
Using a foreign transactions surcharge (FTS) to manage the
exchange rate.
(The
following items have not been revised. They show the historic development of
the work. )
Financial system mechanics explained for the first time. “The Ripple
Starts Here.”
Short summary of the paper The Ripple Starts Here.
Financial system mechanics: Power-point presentation.
"Money
is not the key that opens the gates of the market but the bolt that bars
them."
Gesell,
Silvio, The Natural Economic Order, revised English edition, Peter Owen,
![]()
This work is
licensed under a Creative
Commons Attribution-Non-commercial-Share Alike 3.0 Licence.