NGO Another Way (Stichting Bakens
Verzet), 1018 AM
SELF-FINANCING,
ECOLOGICAL, SUSTAINABLE, LOCAL INTEGRATED DEVELOPMENT PROJECTS FOR THE WORLD’S
POOR.
|
FREE E-COURSE FOR DIPLOMA IN INTEGRATED DEVELOPMENT |
|||||
Edition 01 : 23 January, 2012.
Edition 02 : 21 October, 2012.
Edition 04 : 09 February, 2013.
(VERSION EN FRANÇAIS PAS DISPONIBLE)
Summaries of monetary reform
papers by L.F. Manning published at http://www.integrateddevelopment.org
The
referenced papers :
NEW Capital is debt.
NEW Comments on the IMF (Benes and Kumhof) paper “The
Chicago Plan Revisited”.
DNA of the debt-based economy.
General summary of all papers published.(Revised edition).
How to create stable financial systems in four
complementary steps. (Revised edition).
How to introduce an e-money financed virtual minimum wage
system in New Zealand. (Revised edition) .
How
to introduce a guaranteed minimum income in New Zealand. (Revised edition).
Interest-bearing debt system and its economic impacts.
(Revised edition).
Manifesto of 95 principles of the debt-based economy.
The Manning plan for permanent debt reduction in the national economy.
Missing links between growth, saving, deposits and
GDP.
Savings Myth. (Revised edition).
Unified text of the manifesto of the debt-based
economy.
Using a foreign transactions surcharge (FTS) to manage the
exchange rate.
(The
following items have not been revised. They show the historic development of
the work. )
Financial system mechanics explained for the first time. “The Ripple
Starts Here.”
Short summary of the paper The Ripple Starts Here.
Financial system mechanics: Power-point presentation.
THE MISSING LINKS
BETWEEN GROWTH, SAVING, DEPOSITS AND GDP
By Lowell
Manning manning@kapiti.co.nz VERSION 3
21/10/12
Key words: debt, debt model, deposits, deposit interest,
domestic credit, Fisher equation, GDP, growth, inflation, revised Fisher
equation, saving, savings, systemic inflation, unearned income.
CONTENTS:
1. EXECUTIVE SUMMARY
2. BACKGROUND
3. THE DEBT MODEL
4. DEBT AND DEBT GROWTH
5. THE MISSING LINKS
6. CONCLUSION
ACKNOWLEDGEMENTS
The author wishes to thank Raf
Manji and the Sustento Institute for their ongoing support of this research and
Terry Manning of NGO Bakens Verzet for
his perceptive critique and editing of the drafts.
![]()
This work is Licensed under a Creative Commons 3.0
Attribution – Non-commercial – ShareAlike licence.
1. EXECUTIVE
SUMMARY.
This paper brings
together the concepts explored in a series of earlier papers for which links
are given at the top of Page 3. It
summarises the main elements of two of them,
“The Savings Myth” and “ The DNA of the Debt-Based Economy”. Those two papers show how the current account
and exchange settlement processes work, the principles of production in the
debt- based economy and the concept of systemic inflation.
Section 3 describes
a debt model that can be used to analyse the debt-based economy and concludes
with Figure 8. Figure 8 shows “DNA”
helices that relate GDP to accumulated Saving and Growth. The debt model is a
form of the well-known Fisher Equation of exchange revised so it can be applied
to a debt-based economy.
Section 4 uses the
concepts in Sections 2 and 3 to explain debt growth in more detail. It shows
that when the current account is balanced the overwhelming cause of exponential
debt growth is the unearned income derived from the interest banks pay on
banking system deposits. Figure 11 shows the process of debt creation based on
the banks’ risk based capital, the influences of the central bank and how
government debt is generated.
Section 5 explains
how the differences between the historical orthodox “fractional reserve”
explanation of debt expansion and the existing risk-based capital method of
debt expansion arose. The orthodox explanation was based on a Savings and Loan
model of banking that was discarded decades ago prior to the implementation of
the
The paper shows
that interest on the accumulated investment debt (the GDP according to “The DNA
of the Debt-Based Economy”) can only be paid out of productivity gains made
available from new productive investment.
If the productivity gains are insufficient to fund the interest, the
productive sector must inflate to make up the shortfall.
There are systemic
connections between debt, deposits and GDP.
In
The final section
of the paper discusses the links between debt, deposits, and unproductive
saving, and concludes that the entire modern monetary system is based on
inflation. In a debt-based financial
system, household deposits represent the accumulated cost-push systemic
inflation in the productive economy plus the accumulated demand-pull inflation
of the accumulated current account balance. The net international investment
position (NIIP) could be used instead of the accumulated current account
balance.
Except for real
added production, the financial system debt and deposits are determined
endogenously through deposit interest and exogenously through the accumulated
current account balance [or NIIP].
2. BACKGROUND.
This paper explores
the links between Growth, Saving, Deposits and GDP discussed in some of the
author’s previous papers.
The papers are
available at www.integrateddevelopment.org
General summary of all papers published. (Revised edition).
The DNA of the debt-based economy.
The Savings Myth. (Revised edition)
The interest-bearing debt system and its economic impacts.
(Revised edition).
Manifesto of 95 principles of the debt-based economy.
Unified text of the manifesto of the debt-based
economy.
How to create stable financial systems in four
complementary steps. (Revised edition).
How to introduce an e-money financed virtual minimum wage
system in New Zealand. (Revised edition).
How to introduce a guaranteed
minimum income in New Zealand. (Revised edition).
Financial system mechanics explained for the first time. “The Ripple
Starts Here.” (Original
version, not updated. This is now for historical reference only. Other papers
incorporate up-dates and revisions. )
Short summary of the paper The Ripple Starts Here.
(Original version, not updated. This is now for historical reference only.
Other papers incorporate up-dates and revisions.)
Financial system mechanics: Power-point presentation. (Original version, not updated. This is now
for historical reference only. Other papers incorporating up-dates and
revisions.)
This paper relates
mainly to the papers “The Savings Myth” and “The DNA of the debt-based
economy”.
THE SAVINGS MYTH.
“The Savings Myth”
discusses Saving in relation to the System of National Accounts (SNA) used
around the world to measure economic activity and growth. The paper concludes
there are serious problems with the structure of the national Income and Outlay
and Capital Accounts in the SNA and that
“Saving” recorded in the SNA bears little relation to Savings =
Investment as set out in classical orthodox economics. Some of the main features in the paper are:
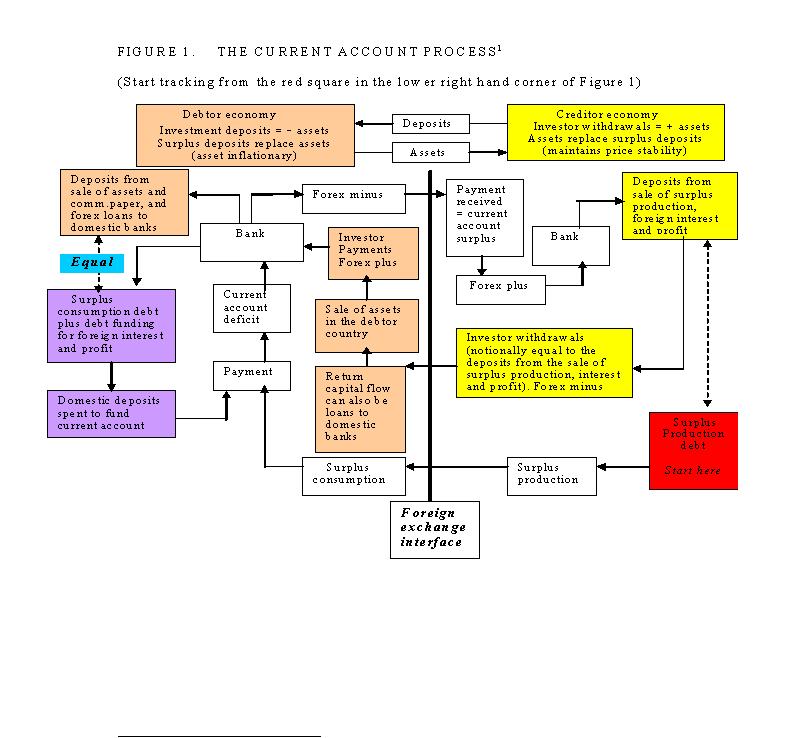
a) A positive balance of external goods and
services swaps domestic consumption goods and services for foreign capital
assets. It is therefore a negative domestic growth factor in the exporting
country at large and a positive growth factor for that country’s business
interests. While it may reflect domestic economic activity it does not reflect
domestic growth because the income is not spent where it is earned.
b) A study of the nature of the current
account and foreign exchange settlement processes shows there is no such thing
as foreign debt. There is only foreign ownership of the domestic economy in
debtor countries when there is an accumulated current account deficit there.
That ownership can be direct or it can be in the form of commercial paper that represents
claims on the domestic economy.
Figure 1 reproduces
Figure 1 from “The Savings Myth”. It
shows how assets and deposits are exchanged through the foreign exchange
interface.
FIGURE 1. THE CURRENT ACCOUNT PROCESS. [1]
[1] The box
“foreign exchange interface” defining the thick black line representing the
interface between the debtor economy and the creditor economy has been added
for clarity as have minor amendments inside two of the text boxes.
Foreign ownership
of a debtor nation’s economy drains its domestic economic growth through
outgoing current account payments of interest on commercial paper and dividends
and profits arising from the physical foreign ownership of its assets.
Foreign ownership
of a debtor nation’s economy exposes it to high interest rates and the
permanent risk of capital flight.
c) The decline in Saving for Investment is
structural. The decline arises from persistent business demand for faster
depreciation allowances. Part of that demand arises from rapid innovation and
planned obsolescence, but part of it is greed.
Higher depreciation provisions usually increases bottom line profits.
That means faster repayment of investment principal and therefore a lower surplus
for productive investment. Less
productive investment means slower growth. National Saving has been swapped for
short-term profit.
d) The structural decline in national Saving
cannot be addressed anywhere in the world using existing orthodox economic
theory and policy.
e) Non-productive “Savings” schemes around
the world (such as Kiwisaver and the so-called “Cullen” Superannuation Fund in
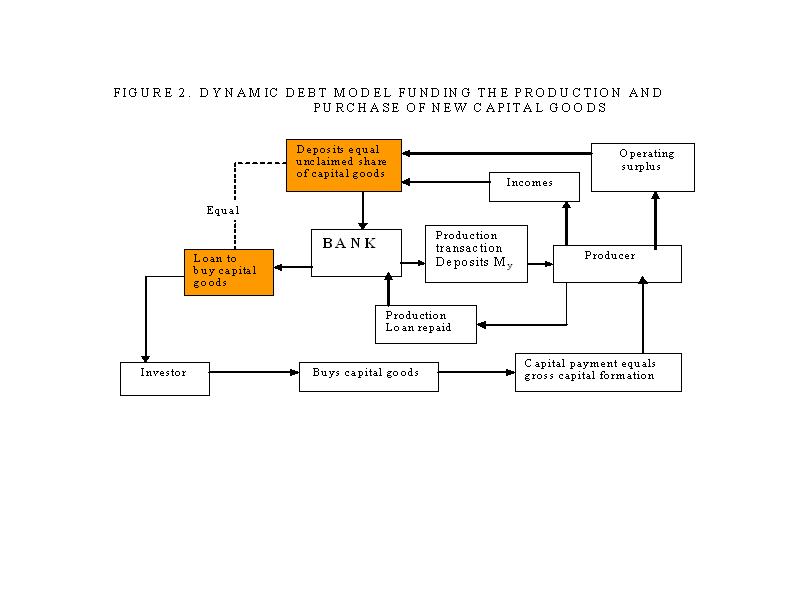
f) Figure 2 reproduces Figure 2 from “The
Savings Myth”.
FIGURE 2. DYNAMIC
DEBT MODEL FUNDING THE PRODUCTION AND PURCHASE
OF NEW CAPITAL GOODS.
Figure 2 shows that
in a dynamic economy the investment process is internal to the production
cycle. There are sufficient incomes in
aggregate to buy the capital goods produced. Some incomes earned in the
production of capital goods are “Saved” by employees and businesses and
subsequently “Invested” by entrepreneurs who wish to buy them. The internal
lending allows the production loans to be repaid. For simplicity Figure 2 does not separately
include loan interest. Therefore:
Saving =
Investment (exactly as is
found in most orthodox economics textbooks)
The internally self-cancelling
production process shown in Figure 2 is mediated by the banking system. At any
time, the total outstanding loans used to buy the capital goods produced equals
the total outstanding principal still owing on those capital goods (the orange
boxes in Figure 2). Net capital
formation, equals “gross capital formation” as shown in the SNA less principal
repayments on existing capital goods.[2]
THE DNA OF THE DEBT-BASED ECONOMY.
The paper “The DNA
of the debt-based Economy” extends the discussion set out in “The Savings Myth”
and relates the systemic processes taking place in the productive economy to
the Fisher Equation provided by Irving Fisher in 1912 [3]
[2] The System of National Accounts (SNA)
incorrectly uses depreciation instead of principal repayments in its Income and
Outlay account because depreciation is not a financial outlay.
[3]
Irving Fisher, “Elementary Principles of Economics”, 1912. The Fisher equation has been very widely discussed
in relation to the economic difficulties arising from the sub-prime mortgage
defaults in the
in his well-known
equation of exchange that takes the form:
MV = PQ (1)
Where:
M = the amount of
money in circulation
V = the speed of circulation of that money; the
number of times M is used over a given period T
P = the price level of goods and services an
economy produces during time T
Q= the
total quantity of monetised goods and services an economy produces
during time T.
The product PQ is
what is known today as Gross Domestic Product or GDP. Some of the main features
in the paper are:
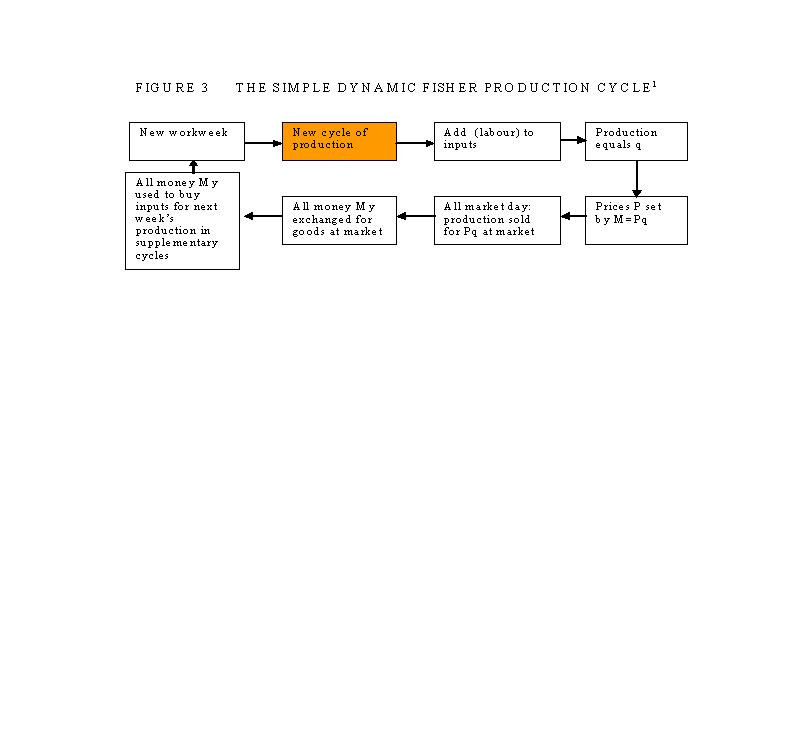
a) Figure 3 reproduces Figure 1 from “The
DNA of the debt-based Economy”.
FIGURE 3 THE SIMPLE DYNAMIC FISHER PRODUCTION CYCLE.
[4]
[4]
“M” in the original Figure 1 is shown as “My” and “Q” in the original
Figure 1 is shown as “q” (that is, Q=q x V) so the terms are comparable with
those in Figures 4 and 5.
The economic
activity shown in Figure 4 is still self-cancelling because there is no interest
included on the debt. It does not show the internal Saving = Investment
function of Figure 2 which focuses on the production and sale of capital goods
as distinct from the broader Gross Domestic Product (GDP) that includes both
capital goods and consumption goods and services. Figure 4 describes the self-funding,
self-cancelling nature of the economic cycle itself as a whole. The green boxes
show the income (production) side, and the blue boxes the consumption side of
the productive cycle.
Because the market
is held weekly there are 52 weekly markets in a year and so on an annual basis
the speed of circulation Vy of the money My
in the Fisher equation in that case would be 52. Figure 2 also assumes that there is no
hoarding (“saving”) of money so that all the money supply My is used each week.
If that were not so either prices P or output q, (or both) would be smaller.
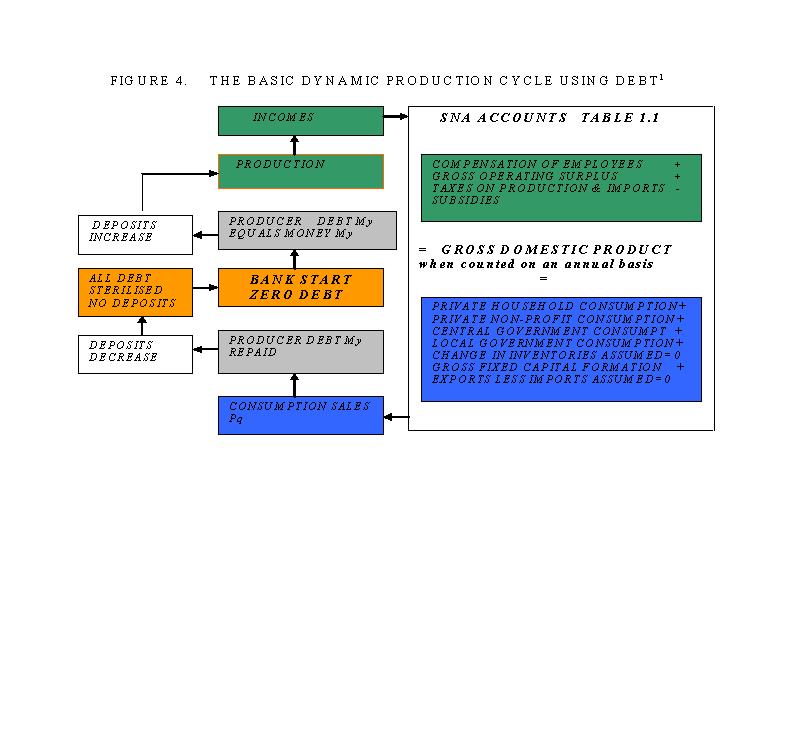
b) Developed economies are no longer
cash-based as shown in Figure 2.
Instead, they have become debt-based.
Figure 4 reproduces Figure 2 from “The DNA of the debt-based
Economy”. Figure 4 shows how debt
instead of money is used in the production cycle shown in Figure 2. It also shows how the basic production cycle
relates to the System of National Accounts discussed in “The Savings Myth”.
FIGURE 4. THE BASIC
DYNAMIC PRODUCTION CYCLE USING DEBT. [5]
c) Figure 5 reproduces Figure 4 of “The DNA of the debt-based economy” [6].
[5] “M” in the original Figure 2 is shown as “My” and
“Q” in the original Figure 2 is shown as “q” (that is, Q=q x V) so the terms
are comparable with Figures 3 and 5.
[6] Three minor text
amendments have been made to make Figure 5 easier to read.
Figure 5 shows what
happens when interest is introduced into the financial system.
The result is a
build up of debt and interest external to the productive
cycle. The productive cycle is then, in
aggregate, no longer self-cancelling.
Instead, it produces unearned income in the form of interest on deposits
that must be funded by the productive economy.
Unearned income, by definition, produces nothing because it is not
backed by productive activity. In Figure 5 If is the average
interest rate paid on deposits. Ms in Figure 5 is the accumulated
pool of unearned deposit income.
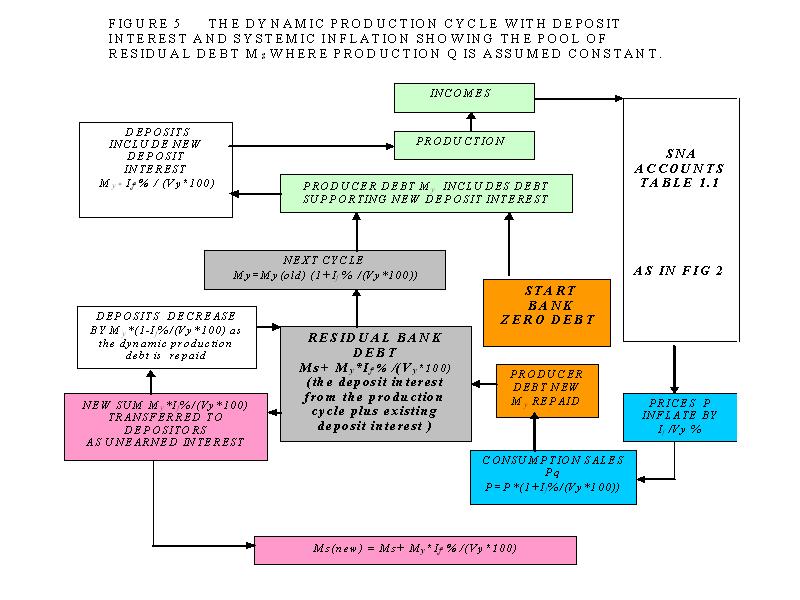
The price change formula P=P*(1+ If % /(Vy *100))
shown at the bottom right of Figure 5 refers to a single production cycle
producing the (constant) economic
output q.
d) Figure 6 of “The DNA of the debt-based Economy” is
reproduced as Figure 6. Figure 6 shows
that, assuming the deposit interest rate If and output q are more or less constant,
physical inflation is half of If %. The figure P* If %
/(Vy *100) is the rate of change of Price P. It must be
mathematically integrated to give the numerical inflation. This aggregate
increase in the annual GDP output caused by the price increases shown in Figure
5 is called systemic inflation.
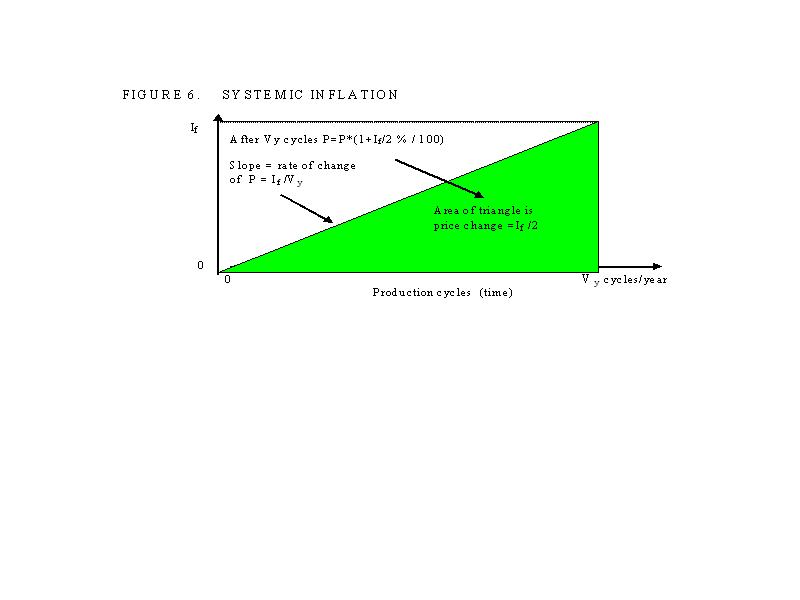
Subject to several qualifications, systemic inflation is therefore equal
to half the average interest rate paid on deposits. [7]
[7] The qualifications are that incomes
rise with inflation plus productivity growth, that there are no changes in
indirect taxes included in the price level P, and that aggregate net
contributions to non productive savings schemes are funded by debt from outside
the productive economy.
At this point, the financial system is made up of:
i) the self-cancelling
cycles of production shown in Figure 4 that includes internal Savings =
Investment as shown in Figure 2, funded by a dynamic pool of transaction
account debt supporting the productive
transaction deposits.
ii) the systemic inflation
arising from deposit interest shown in Figure 5 represented by the accumulated
unearned income.
iii) the accumulated debt,
including government bonds, borrowed to service the current account shown in
purple at the bottom left of Figure 1. Deposits corresponding to that debt
arise from the sale of debtor country assets together with commercial bank
foreign exchange borrowing to satisfy the foreign exchange settlement
requirements (top left of Figure 1).
iv) any expansionary “bubble” debt
representing debt borrowed outside the productive economy to fund the purchase of
existing assets.
3. THE DEBT MODEL. [8]
At any point in
time in the debt system there are five broad blocks of deposits and some
circulating currency in the domestic financial system.
They are:
Mt The transaction deposits representing the
productive debt My - M0y so:
My = Mt +
M0y (2)
M0y is
the cash in circulation included in My and used to contribute to
productive output.
Mca is
the accumulated domestic deposits representing the sale of assets to pay for the
accumulated current account deficit. It equals Dca defined below
less the Net Foreign Currency Assets (NFCA).
Ms is
the accumulated deposits arising from unearned deposit income on the total
domestic banking system deposits M3 (excluding repos). [9]
M0 is the total
cash in circulation so that (M0-M0y) is cash hoarded by the public and not
used to generate measured GDP.
The total of Mt + M0y + Mca
+ Ms, is provisionally assumed to be the monetary aggregate M3
(excluding repos) published by most central banks monthly, less the amount of
cash in circulation M0 except for the part M0y that is included in My. M0y is assumed to have the same
speed of circulation as My. In industrialised countries, the
contribution of cash transactions to the measured output of goods and services
(GDP) has been declining in recent decades and their contribution to the GDP
has been provisionally calibrated for the purposes of this paper. [10]
The total debt in
the domestic financial system is assumed to be the Domestic Credit, DC debt
aggregate published by most central banks monthly. [11]
[8] The effects
of secondary non-bank lending are not included in Section 3 but they are
considered later.
[9] Repos refer
to inter-institutional lending.
[10] More accurate
assessment of the cash contribution to GDP over time requires further detailed
study.
[11] At this
point the model does not include secondary non-bank lending thought to be
around 10% of DC. This point is considered in Section 4 of this paper.
[12] The accumulated
sum of capital transfers could be included here, in which case the net
international investment position (NIIP) would be used instead of the
accumulated current account. The decision affects the size of the “residual” Db.
At any point in
time there are four broad blocks of domestic debt in the domestic financial
system. Three of them together add up to DC such that:
DC = Dt + Dca [12] + Dr
(3)
Where:
Dt is
the productive debt supporting the transaction
Dca is the whole of the debt created in the
domestic banking system to satisfy the accumulated current account deficit.
[13]
Dr is the residual debt to balance
equation (3).
Db, is
the virtual “bubble” debt, the excess credit expansion or contraction in the
banking system such that Dr - Db = the debt Ds supporting the
accumulated deposit interest Ms defined above.
Therefore, Dr= Ds+Db. Db can be positive or negative.
By definition in
this paper : My x Vy = GDP; and Ms = Ds
; and Dr=Ds+Db, and
Dt= My-M0y;
and the cash contribution to GDP = M0y * Vy. .
By substitution
into equation (3): [DC = Dt + Dca [14] + Dr
]
[13] This is greater than the monetary deposits Mca
because the banking system may have sold commercial paper to borrow foreign
currency to satisfy the foreign exchange settlement as shown in Figure 8.
[14] The accumulated sum of capital transfers could be
included here, in which case the net international investment position (NIIP)
would be used instead of the accumulated current account. The decision affects
the size of the “residual” Db.
DC = (GDP)/Vy - M0y + Ms + Dca
+ Db (4)
Ms =Ds = (DC – Dca ) – GDP/Vy + M0y
- Db (5)
GDP = Vy *(DC - (Ms +Dca
+Db ) + M0y ) (6)
My = GDP/Vy = DC - (Ms +Dca + Db) + M0y (7)
where the terms are
as defined above.
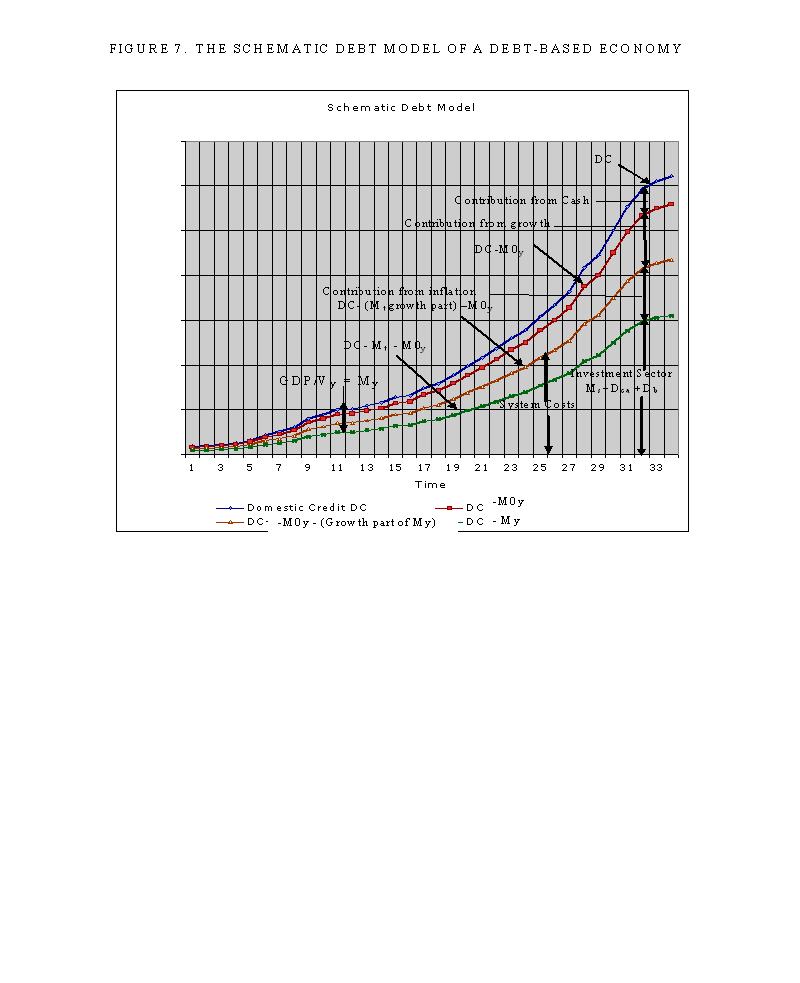
Equations (4) to
(7) are all forms of the economic debt model shown in Figure 7.
In equation (5),
all the terms except GDP/Vy = My and Db are
known or can be estimated with reasonable accuracy. My can be
approximated in equations (4) and (5) using trend-lines because it is small
compared with Ms and DC. Db is unknown but can be
approximated through model calibration. The calculations in equations (6) and
(7) involve the subtraction of large numbers to get relatively small numbers,
which leaves them sensitive to modelling and data error.
If Ms,
calculated as “the accumulated deposits arising from unearned deposit income on
the total domestic banking system deposits M3 (excluding repos) ” as
defined on page 10, agrees more or less with that calculated in equation (5),
bearing in mind the value of Mb, the proposition that debt growth is
determined by deposit interest will be proven.
The model will require further calibration as further data becomes
available.
FIGURE 7. THE
SCHEMATIC DEBT MODEL OF A DEBT-BASED ECONOMY.
Db will be
positive during periods of rapid expansion, particularly as bubbles form, and
will become negative during periods of rapid contraction, particularly as
bubbles collapse. The classic case of this in
[15]
This is discussed at length in the paper “The interest-bearing debt
system and its economic impacts” referenced above.
The dependence of the
gross domestic product (GDP) on the Domestic Credit DC and the interest rate on
bank deposits in the modern cash-free economy from which Ms is
calculated has profound implications for economics.
In the light of the
worldwide financial chaos of 2007-2009 the indicative debt model shown in
Figure 7 provides a powerful argument in support of public control of a
nation’s financial system. In Figure 7, the blue curve (DC+M0y) is drawn to
scale (the total was about NZ $310 b. in
The present
debt-based system shown in Figure 7 leaves the world economy at the mercy of
private banking institutions working for private profit by allowing
irresponsible increases and contractions (Db in equations (4) to
(7)) of the Domestic Credit and its associated bubble formation. The problem is
systemic because the existing financial system requires exponential growth. In
the case of
It probably isn’t
possible to have a simpler model of the economy than equation (7):
My =Nominal GDP/Vy = domestic
credit DC less (accumulated unearned deposit income Ms + the
accumulated current account deficit Dca + the cash contribution to
GDP, M0y plus a correction for bubble activity Db (+/-))
Domestic
The difference
between the two curves is mainly the result of domestic debt needed to fund the
accumulated current account deficit that, in
It does not appear
to be theoretically possible to maintain exponential debt expansion faster than
the GDP expansion over an extended period because the added debt servicing
costs will always leave the productive sector insolvent.
To avoid national
bankruptcy, each nation must maintain, in aggregate, a zero accumulated current
account deficit.
The financial
system is dynamic. The debt used to
purchase capital goods is continually repaid from economic growth. In
aggregate, as long as new investments exceed repayments, both the debt and
deposits expand together. The paper “The DNA of the debt-based Economy” shows
that the total outstanding Saving and the total outstanding debt at any time
are equal to the aggregate sum of economic growth and that this must also equal
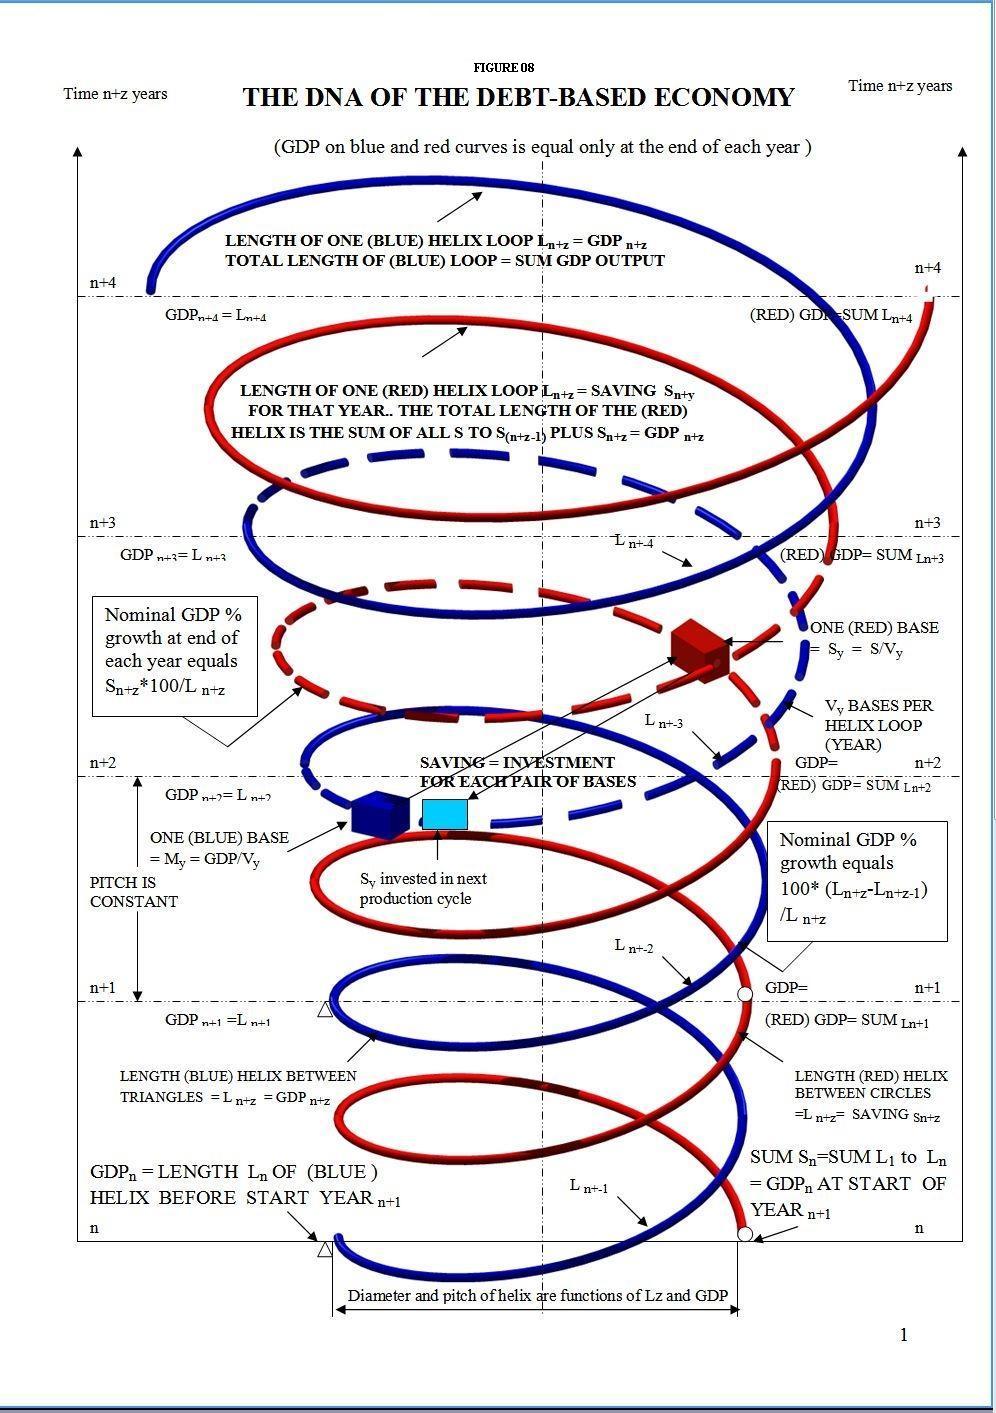
the GDP as shown as Figure 8.
The following
three-dimensional diagram (Figure 8) represents the DNA of the debt-based
economy. It is tilted forward from the top to make its features easily
understandable.
The diagram is made up of two
mirrored helical strands of financial DNA. The blue strand represents the total
accumulated GDP output for a given period while the red strand represents the
total outstanding productive investment principal. The vertical axis of the
helices represents time. The diagram shows a random period of four years.
On the blue helix, Vy
bases of production output My are added over the time span needed to
make one full turn of the blue helix (usually a year). On the red helix, Vy
bases of national saving Sy (net new productive investment) are
added over the time span needed to make one full turn of the red helix (usually
a year). For ease of consultation, the bases are shown only for year three. The
drawing shows nineteen of them, as this is the approximate speed of circulation
Vy of productive deposits My in
The helices replicate by
extension. The blue helix showing GDP “dies off” at the end of each period. The
helices grow exponentially by the transfer of net Saving Sy from the
blue helix to the red one over each notional production cycle.
For each of the bases the
national saving Sy is returned to the next production cycle on the
blue helix in the form of net new capital investment Sy (Saving =
Investment) as shown. Individual bases can vary in size (up or down) reflecting
the state of the economy.
The annual length or growth
ring Lz of the blue helix shows the GDP as it accumulates during
that year. The nominal, usually annual, GDP growth in the blue DNA is the
change in length Lz of the DNA spiral over the period z compared
with the corresponding length L z-1 over the previous period. In the
diagram, the length (and therefore the diameter) of the GDP spiral is shown to
be increasing exponentially from year to year.
The annual increase in the
length of the growth ring Lz of the red helix shows the annual increase in outstanding investment
principal S which also equals the nominal GDP growth for that year. The total
length of the red helix at any time is the sum of all outstanding investment
principal. It equals the current
(annual) GDP at any time.
At the end of each (annual)
period z (and only then) the value of output represented by length Lz
of the blue helix (the GDP for that year) equals the value represented by the
whole of the red helix (its total length representing the sum of all
outstanding investment principal).
The plan diameter of the
helices typically expands exponentially. The helices vary together with the
state of the economy. In the case of recessions they show up as changes in the
annual rate of increase of the helix
diameters, and therefore the length of the spiral loops. In the case of
depressions they would show up as an actual
annual decrease in the helix diameters.
FIGURE 8. THE DNA OF THE DEBT-BASED ECONOMY.
n n+2 n+3 n+4 EACH (BLUE) BASE=My =GDP/Vy![]()
![]()
![]()
4. DEBT AND DEBT GROWTH.
The following
sections of this paper explore the relationships between the debt model
variables and the DNA of the debt-based economy shown in Figure 8. At first
sight, Figure 8 suggests a Saving and Loan model of financial
organisation. It shows that
collectively, those with incomes derived from the production of capital goods
(savers), must invest those incomes by buying the capital goods they have
produced. If they do not do so the
market cannot be cleared of those capital goods unless their purchase price is
borrowed from the banking system. If the purchase price to buy the capital
goods is borrowed from the banking system, there are surplus “hoarded” deposits
held by the savers. Those deposits would then remain in the bank with nowhere
to go other than for non-productive investment in existing assets.
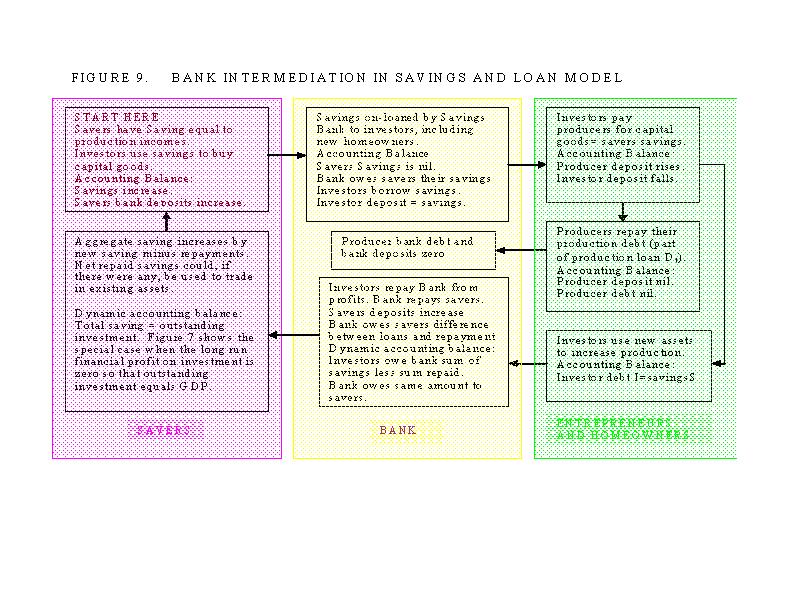
Figure 9 shows a
Savings and Loan model described above. [16] In Figure 9, the Saving deposits
become physically unavailable to the savers for a time. The investor uses them to pay the producers
of the capital goods. The producer uses them to cancel the production debt
created to produce the capital goods. At
the start, the investor has a debt to the Savers and an asset represented not
by a deposit but by the asset itself. At
the end the investor has no debt and the savers regain their deposit (with
interest).
[16] This is an idealised diagram
that assumes producers and entrepreneurs are different groups. This is
discussed further at Section 5.3.
FIGURE 9. BANK INTERMEDIATION IN SAVINGS AND LOAN MODEL.
In Figure 9 there
is no net bank debt created. The savings repaid by investors to Savers are
available to trade in existing assets. The amount available is the original purchase
price of the assets less the outstanding loans. When an existing capital asset
is on-sold, the purchaser typically borrows the (re) purchase price from the
banking system. The original asset owner
(investor) repays his outstanding debt to the Savers, and, depending on the
sale price and outstanding principal may make a capital gain.
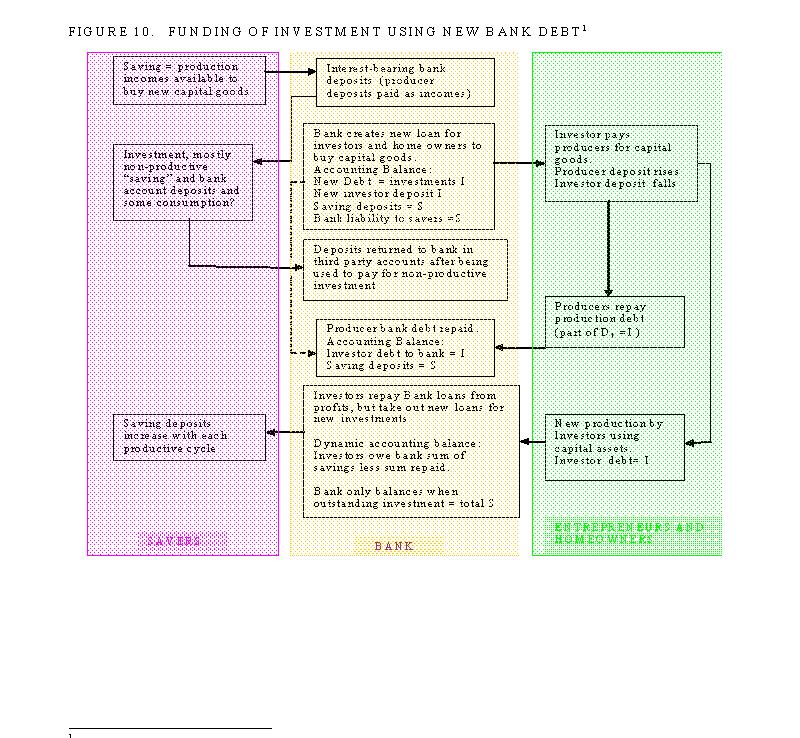
Figure 10 shows
what happens when investment is funded by commercial bank debt rather than
rather than internally from Savers.
FIGURE 10. FUNDING
OF INVESTMENT USING NEW BANK DEBT.[17]
[17] Figure 10 is an idealised
diagram that assumes producers and entrepreneurs are different groups. This is
discussed further at Section 5.3
The main difference
between Figures 9 and 10 relates to the existence of bank debt. In the Savings and Loan model (Figure 9)
there is no net bank debt involved because the bank has on-loaned the savings
deposits. Savers (at least nominally) do not have access to the their deposits.
Only net repaid investment loans would be available to pay for the exchange of
existing assets. When savings S = Investment I, there are no net repayments.
The bank-funded model (Figure 10), on the other hand, involves bank debt and
Savers have full access to their bank deposits. The dynamic balance in Figure
10 only also holds when the total outstanding investment equals total saving.
Savings S in Figure
10 must be invested in some other kind of investment because there is nothing
new to buy with them. That applies even if it means just leaving them on
deposit at the bank. In the paper “The Savings Myth” savings of this kind are
referred to as a myth. The investment is backed by debt rather than
savings and so does not qualify as investment as required by the principles of
orthodox economics.
The difference
between the Savings and Loan operation where the Savers’ deposits are used to
retire the production debt, and the bank intermediation outlined in Figure 10,
is profound. In the former case, shown
in Figure 9, Savers hold an IOU (rather like a corporate bond) from the
entrepreneurs and new homeowners while the entrepreneurs and new homeowners
have their capital asset on the one hand, and the debt to the savers as a
liability on the other hand. There are
no corresponding deposits in the system because they have been used to repay
the residual part of the production debt Dt.
In Figure 9, savers
lend to entrepreneurs and homeowners while in Figure 10 the bank lends to
entrepreneurs and homeowners. In Figure 9, the Savings are used to retire the
producer debt whereas in Figure 10 the deposits arising from the new bank loans
are used to retire the producer debt. So
Figure10 introduces a new layer of debt and deposits into the system that were
not there before.
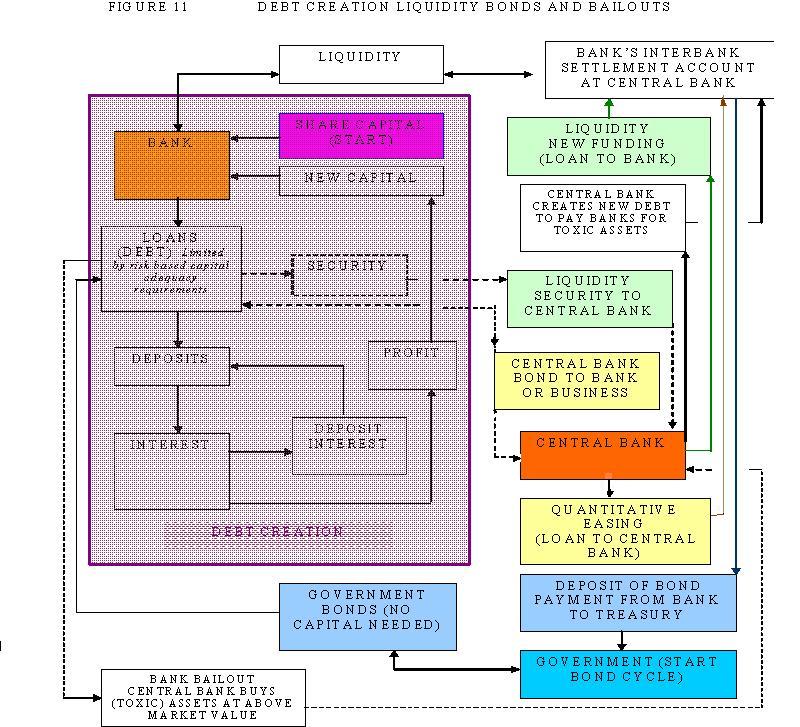
In the
existing debt-based economy almost all money is created as interest-bearing
debt and almost every deposit arises from a bank loan. Borrowers typically sign a loan agreement
before their bank gives them credit by putting money into their bank
account. The bank creates the money out
of nothing. The loan is an asset of the
bank because the borrower agrees to repay it over time. The deposit is a
liability of the bank because the bank allows the borrower to use the money it
has created in return for the interest he or she pays on the loan. The process is shown in Figure 11. For completeness Figure 11 also shows the
role of the central bank in creating bank liquidity, quantitative easing and
bailout funding and the banks’ lending to the government to fund government
debt.
Contrary
to what happens under the savings and loan model (Figure 9), banks never
lend their customers deposits in the debt model shown in Figure 11 because
doing so would deprive the borrower of the right to use of the money they have
borrowed. In accounting terms banks cannot lend their liabilities. This is different to the Savings and Loan
model (Figure 9) where savers do not automatically have access to their
deposits until their term deposit matures. [18]
[18] This is the basis, for example, of the
Investment Pool in the Bank of
From the relationships
shown on page 11 the following derivation can be developed
DC = Dt + Dca + Ds + Db (8)
Of the total, Dt alone
relates to the dynamic transaction account debt used to fund the productive
economy.
The rest makes up the so-called (non-productive) “investment sector” that
trades in existing capital goods and financial assets. The non-productive investment sector
can be called Di such that:
Di = Dca + Ds + Db (9)
Equation (8) is a
modified form of the well-known Fisher Equation of Exchange (M*V=P*Q) described
in Section 2 that takes account of the debt-based economy.
Domestic
DC= M3 – NFCA - R (Residual) [19] (10)
[19]
Many central banks regularly publish financial aggregates that clearly
demonstrate this relationship. Residual includes the banks’ net worth and
several smaller items. NFCA is Net Foreign Currency Assets. As previously noted at footnote 11 the debt
model does not at this point provide separately for secondary non-bank debt,
nor does it allow for a substantial proportion of cash transactions.
Which can be rewritten as
M3- (NFCA + R) [20] = DC
. If the monetary deposit base of the economy
is taken as (M3-repos) rather than M3 to remove the effect of
inter-institutional lending, and since in the productive sector My=Py*Qy/Vy,
and in the investment sector Mi=Pi*Qi/Vi,
equation (8) can be rewritten as the Fisher equation where
(M3-repos)=Py*Qy/Vy+ Pi*Qi/Vi
=(Dt +M0y)+ Di+ (NFCA+R) – repos (11)
Where:
Di is as in equation 9, Pi is
the price level in the investment sector, Qi is the quantity of
investment assets (or alternatively the quantity of investment assets
exchanged) over any given period and Vi is the speed of circulation
of Di. Vi will depend on which version of Qi
is used.
[20]
Except where the entire banking system is insolvent (that is, has
negative net worth), R is a negative number.
NFCA is also likely to be negative in debtor countries (like
Debt growth in the
investment sector is exponential because, as shown in the debt model (described
at section 3 of this paper) any interest rate creates an exponential curve when
the interest is continually added to the existing debt. Debt growth in
the productive sector must also be exponential because the productive sector
has to fund the investment sector debt Di. The growth rate of the
total debt DC will change over time according to the interest rate and physical
changes in the debt base like those arising from the balance of trade,
population growth and productivity.
FIGURE 11 DEBT CREATION LIQUIDITY BONDS AND BAILOUTS.
The prices of existing capital
assets tend to rise whenever the pool of investment sector debt Di
increases faster than the net value of new capital assets being added to the
investment pool. Asset prices can also be affected when savers (non-productive
investors) "sit on the sidelines" by leaving their deposits "in
the bank". In that case, the speed
of circulation Vi falls, which means either asset prices will fall
or there will be less trading so that Qi falls, or both.
The increase in domestic
debt DC is net of debt repayment, so when some non-bank investors deleverage,
or "take losses" to repay their debt, Di will be lower
than it otherwise would have been and asset prices will tend to remain static
or sometimes fall. In
[21] For example, under the proposed Bank of
England (Creation of Currency) Bill the repeated on-lending of Customer
Investment Accounts would create a very large pool of bank debt outside of the
Domestic Credit or monetary deposit figures.
Call Dnb the pool of all non-bank created debt and call Msnb
the accumulated interest paid to depositors arising from Dnb. Since Dnb
does not directly add to deposits (contrary to Ds which is assumed
to mirror Ms, and Mb which is assumed to mirror Db
in the debt model), then:
DC + Dnb =(Dt + Ds + Dca+ Db)
+ Dnb (12)
M3(-repos) = Mt + M0y
+ Mca + (Ms + Msnb ) (13)
That means that if
interest rates remain comparable, (M3-repos) and DC both have an extra
exponential added to them to supply the extra deposits Msnb. Remembering that
from page 10, Mca=Dca+ NFCA, and (Mt+M0y)=My
then
DC = (Mt+ M0y)
+ [Dca + NFCA] + (Ms
+ Msnb) + repos - (NFCA
+R )
= My + Dca + (Ms + Msnb) + (repos -R ) (14
)
If the
current account is balanced, the overwhelming driver of exponential debt growth is the
interest paid on deposits.
If
secondary lending in the form of non-bank debt Dnb were to become an important factor as it
would, for instance, if the proposed Bank of
From equation (11) DC= Pt*Qt/Vt
+ Pi*Qi/Vi - [(NFCA+R) – repos], when DC increases sharply
the investment sector Pi*Qi/Vi will also
usually increase. Since there is, in
normal times, little reason for Qi to increase sharply or for Vi
to decrease sharply, investment prices will usually tend to rise faster than
the productive economy whenever DC increases faster than nominal GDP growth.
[22]
[22] Qi and Vi can
move in tandem, as, for example, when there is a slump in house sales due to
recession or changes in bank lending criteria, especially when an exchange form
of Qi/Vi is used.
5. THE MISSING LINKS.
5.1 CAPITAL BASED AND DEPOSIT BASED DEBT
GENERATION.
The confusion over how
debt is created is astounding. The box on the left of Figure 11 clearly shows
how debt is created in the present debt-based system. In the capital based
system a bank can and does typically create debt on demand as long as it meets
its capital and liquidity requirements and provided the bank is prudent and has
creditworthy customers.
In the
present debt-based system deposits follow debt creation.
The “competing” deposit
story of debt creation arises from the Savings and Loan model shown in Figures
8 and 9 that follows from the orthodox economic theory shown in Figure 2. That theory states that savings, productive
investment and debt growth are three sides of the same triangle. Savings =
Productive Investment, and the cumulative investment is the cumulative debt
owed by homeowners and entrepreneurs to income earners generally.
In the
Savings and Loan model, debt follows deposits instead. The deposits are
expended to repay the production loans. Savers give up their deposits in return
for an IOU (debt) from entrepreneurs and new homeowners.
The orthodox model
applies only in a Savings and Loan system where the actual Saving is on-loaned
to the buyers of capital goods. In that
case, savers do not have immediate access to their deposits.
The debt system is
not operated on a Savings and Loan basis.
Instead, Savers, as shown in Figure
5.2 INTEREST AND EXPONENTIAL DEBT.
Nominally, the only
deposits in a Savings and Loan system are the dynamic deposits My in
the productive sector. That changes in the debt-based system shown in Figure 10.
Since domestic housing is not usually productive once it has been built, both
the repayments and the interest relating to domestic housing must be funded
from productivity growth if the economy is to remain stable. The productive economy must therefore fund
interest and repayments for both the productive sector and the unproductive
(housing) sector.
Any interest on the
accumulated productive investment debt (GDP in “The DNA of the Debt-Based
Economy”) must be paid out of productivity gains and the corresponding higher
incomes made available through the new productive investment. Otherwise
according to the debt model (equation (11)) prices in the productive sector
must inflate .
The economy will
become unbalanced very quickly if the interest and repayments on new housing
investment exceed what the productive economy can support. If the productive
sector inflates, My in the debt model (Section 3 of this paper) will
expand exponentially even though it is small.
That is exactly what happened when money was used instead of debt in
centuries past and the coinage was often debased by reducing the amount of gold
and silver in the coins. This was done to pay for non-productive expenses, such
as unsuccessfully waging war where the “booty” failed to cover the war costs.
Exchange of
existing capital assets in a Savings and Loan system occurs by selling the
asset for its market value. Any remaining debt on the asset is repaid, and the
new owner re-borrows the new purchase price.
The system remains balanced as long as the market value equals the
original purchase price less the principal repayments already made, its
“residual” purchase cost. If there has been inflation, or if, for some reason,
the new owner pays more for the capital asset than its “residual” purchase
cost, there is nowhere to obtain the extra funding within the savings and loan
system. In that case the additional part of the purchase price must be paid for
from new bank borrowing.
Banks lend money to
make money. The net profit they make on their bank spread (the difference
between the interest rate they charge borrowers and the interest rate they pay
on their deposits) is legitimate income, just like profit in any other
business. The difficulty with the banking system is that more lending typically
means more profit. It is, therefore, in the banks’ interest to lend as much as
they can.
There are four main
ways to increase bank lending.
The first way is by
minimising the contribution of cash transactions counted in the GDP. In many developed economies the cash
contribution to the economy is approaching zero. While there are still a lot of cash
transactions, they add very little to GDP.[23]
Cash in circulation also “uses up” bank capital, because the bank swaps
vault cash (capital) for a customer deposit. The customer deposit costs the
bank far less capital because, unlike cash, the bank can use it authorised
capital leverage when it creates the loan that gives rise to the deposit.
[23] For example, cash is still widely used
in retailing in many developed countries, but the average net profit on those
transactions is small and retailing as a whole makes up only a relatively small
part of GDP (say, 10%). Say, roughly 20% cash transactions x 10% GDP
= about 2% contribution to GDP.
The second way to
increase bank lending is to raise capital by retaining profits or by issuing
new shares. If the authorised bank leverage were 8%, the banks would be able to
lend about 12 times their capital. More
capital means more lending.
The third way to
increase bank lending is to lend to governments, because sovereign debt is
typically, though by no means always, deemed to be risk free. Therefore there are usually few limits on the
amounts governments can borrow as long as the nation’s tax base is deemed large
enough to support the interest payments on the public debt.
The fourth and
possibly most important way to increase bank lending is to pay interest to
depositors. Section 2 of this paper
shows how deposit interest causes systemic inflation. Equation (14) on
page 21 shows that, apart from persistent accumulated current account
deficits, the increase in the
accumulated deposit interest (Ms + Msnb) over time is by far the
biggest contributor to exponential debt growth. In equation (14) when (Ms + Msnb)
increases, debt measured as domestic credit (DC) increases by the same amount.
The work referred
to at the start of Section 2 of this paper is thought to be the first in the
world to demonstrate the systemic links among deposit interest, inflation and
exponential debt growth.
5.3 THE LINKS BETWEEN DEBT, DEPOSITS AND GDP.
The debt model and
“The DNA of the Debt-Based Economy” shown in Figure 8, and Figure 9 hints that
the system deposits should, in some way, be related to My +
GDP.
From equation (13)
on page 21, M3(-repos) = Mt + M0y + Mca
+ (Ms + Msnb
)
Since Mt + M0y
= My, GDP should be directly related to Mca + (Ms
+ Msnb ) in the above hypothesis. The debt model described in
Section 3 of this paper proposes that the quantity of debt determines economic
outcomes in accordance with a modified version of the Fisher equation of
exchange.
The postulated direct link
between the money supply and GDP is the last missing element in the debt model
that already directly links deposit interest, inflation and exponential debt
growth, as noted above. Linking the
money supply directly to GDP will provide further powerful support for the
quantity theory of money and debt proposed by the debt model.
In
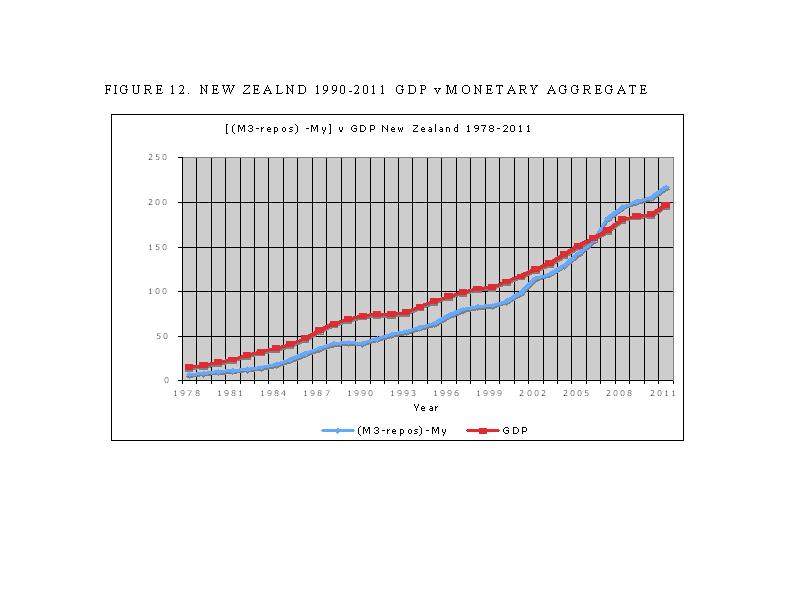
Figure 12 gives the figures
for
The purpose of this paper is
to indicate the links between the theory proposed in “The DNA of the Debt-Based
Economy” and the monetary aggregates. There is no reason to suppose deposit
aggregates “should have” followed GDP on a one to one basis in practice. The
“wobbles” about the trend line can easily be related to the boom and bust
periods and the creation and “popping” of bubbles (Db in equations
(8) and (9)).
FIGURE 12. NEW
ZEALND 1990-2011 GDP v MONETARY
AGGREGATE.
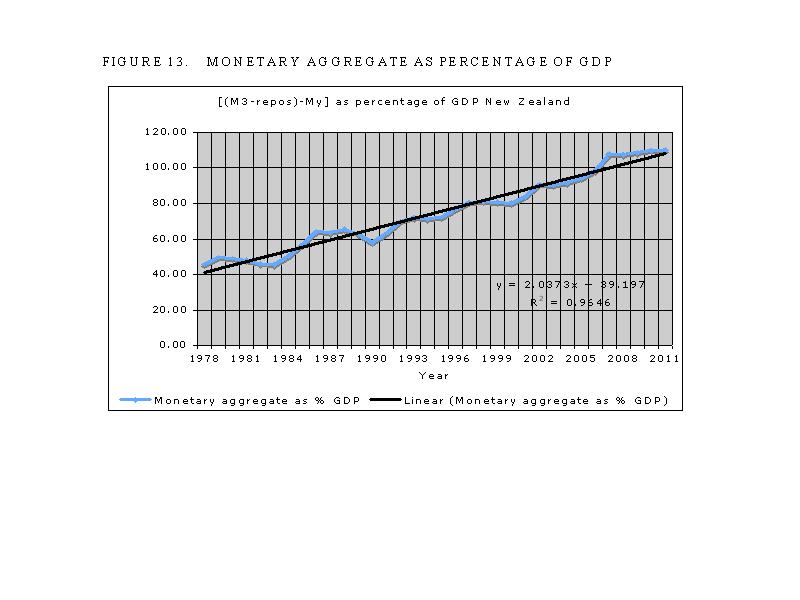
FIGURE 13. MONETARY AGGREGATE AS PERCENTAGE OF GDP.
There are five main reasons why
there is not a direct one to one relationship between the monetary aggregate
and GDP in Figure 12. Each of those reasons is systemic and can be quantified
with further research.
The first reason is that a lot
of funding of the purchase of capital goods used to be done using the Savings
and Loan model shown in Figure 9. Savings and Loan funding for new capital
assets does not generate bank deposits.
In
The second reason is that
businesses used to retain profits and reinvest them directly in new
capacity. In the idealised funding
models shown in Figures 9 and 10, it was assumed that all the Savings were
saved as deposits and on-loaned to entrepreneurs and homeowners. However, that
has never been wholly so. When producers collectively contribute their own
profits to the purchase of some of the capital goods they themselves produce,
those profits (Saving) are converted to equity. There is then less borrowing
needed from other income earners or from banks. Increased corporatisation and
globalisation in ever more deregulated capital markets have all but eliminated
the retention of profits for reinvestment. [24]
[24]
The third reason the GDP to
deposit ratio has changed is increased social mobility. More people move more
often which creates more sales of existing capital assets, especially
homes. As discussed at page 24, this can
create demand for new bank lending where the amount paid for the asset exceeds
the outstanding debt on the asset. This
applies even though the buyer may have some equity or “savings” either from the
sale of a previous home or from some other source.
The fourth reason is that in
The fifth reason is that
personal incomes have not been rising fast enough to enable most people,
especially homeowners, to meet their capital debt-servicing commitments. The problem arises from growing income
distribution inequality around the world. [25] As that inequality increases,
home ownership typically becomes less affordable. In
[25] This is discussed in the paper “How to
create stable financial systems in four complementary steps.” for which a link
is provided at the start of Section 2 of this paper.
Amounts
attributable to each of the four factors mentioned can be quantified. Further
research will show that, subject to those factors, there is a direct and specific
relationship between banking system deposits and GDP.
Figures 12 and 13,
the debt model, “The Savings Myth”, and the “DNA of the Debt-Based Economy”
demonstrate how very poor public understanding of the financial system
mechanics has produced so much economic instability around the world. The role
of the banks in that overall process deserves wide public debate. The single
most relevant observation from this paper is that the financial system is
fundamentally flawed and requires major systemic review.
5.4 THE
RELATIONSHIP BETWEEN DEBT, DEPOSITS AND UNPRODUCTIVE ‘SAVING”.
Conceptually, no
deposits arise from productive Investment (see Figure 9). Saving = Investment both in orthodox
economics and in “The DNA of the Debt-Based Economy” create debt but no
deposits. According to the debt model
described in Section 3, the fewer deposits there are the less inflation there
will be.
As discussed in
Section 5.3, the real world is, however, different in that the deposit base has
become more like Figure 10 with some add-ons such as the ones derived from the
third and fourth reasons on page 27 and the fifth reason referred to
above. The more bank debt is used the
larger Ms in the debt model will become, increasing the
non-productive investment “savings” pool.
In practical terms
all price is inflation. That must be so because inflation is measured by prices
rises. Those price rises are accumulated over time, so, in the limit, all price
is inflation. “Cost-push” price inflation
is caused by the payment of unearned income in the form of interest to deposit
holders. [26] The unearned income is
funded by systemic inflation in the productive economy. Inflation in the productive economy increases
the prices of new capital assets as well as consumer goods and services. Therefore numerically, the GDP is also almost
entirely made up of inflation and that in turn means that the price of new
capital goods is almost entirely made up of inflation. If the price of new
capital goods is almost entirely inflation, then the debt used to buy them also
reflects that inflation.
[26] The other kind of inflation,
demand-pull inflation occurs when more money is injected into t he economy in
the absence of a corresponding increase in production.
The entire modern
monetary system is founded on inflation.
Section 5.3 showed there are
specific quantifiable links between GDP and deposits. In equation (13) [M3(-repos) = Mt+ M0y
+ Mca + (Ms + Msnb )], the amount (Mt
+ M0y) is the dynamic production deposits My while
the sum
(Ms + Msnb
) is the systemic “cost-push” inflation from the productive sector. Mca
, on the other hand, mostly represents “demand-pull” inflation in the
non-productive investment sector caused by the sale of domestic assets to
foreigners to settle the foreign exchange mechanism in those countries with
accumulated current account deficits as shown in Figure 1.
None of the deposits arises
from choice. They arise from necessity in that they are a consequence of the
current financial system mechanics. The deposits exist. Their owners “invest” them in non-productive
investments. Everything that doesn’t belong to the productive sector My
is by definition non-productive. In
Most countries’ central banks
provide a breakdown of who holds the deposits.
The data for
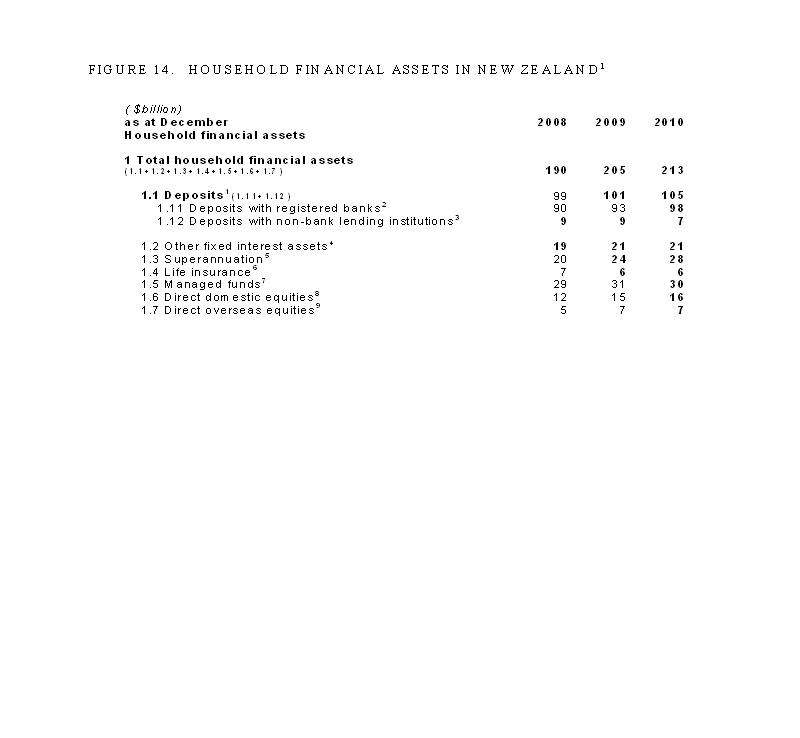
FIGURE 14.
HOUSEHOLD FINANCIAL ASSETS IN NEW ZEALAND.[27]
[27] The table is part of Table HA&L
(Household Assets and Liabilities) published by he Reserve Bank of
The household deposits
represent the accumulated cost-push systemic inflation plus the accumulated
current account-based demand-pull inflation of the debt system.
In the case of
In the first
instance, the effect of compulsory saving is to transfer earned incomes to the
non-productive investment pool, Mi , [Mi = Mca + (Ms + Msnb ) from equation (13)]. If consumption remains the same, the
“savings” withdrawals leave less income for debt servicing and to pay for
capital goods forcing an increase in bank borrowing or a decrease in new
capital investment, or both, as discussed at length in “The Savings Myth”.
More generally,
except for added real production, financial system debt and deposits have just
two sources. The first source is the
debt and deposits created endogenously through deposit interest on the
productive transaction accounts in the productive sector (Figure 5). The second
source is the debt and deposits created exogenously through the accumulated
current account deficit debt Dca and the deposit interest on that
part of it (Mca) returned to the debtor country following the sale
of domestic assets to foreigners (Figure 1).
Unproductive
“saving” is determined by the system mechanics. Government decisions requiring
forced saving are like squeezing a balloon.
The contents remain the same until the balloon breaks. Otherwise, an expansion in one place means a
contraction somewhere else. Economic
growth means blowing more air into the balloon instead of squeezing the air it
already holds. The extra air is
generated from increased economic activity. That means jobs, incomes and productive
investment.
Macroeconomic
numbers partner economic activity, they don’t lead it.
6. CONCLUSION
This paper closes
the theoretical loop established in the series of earlier papers for which links
are provided at the top of page 3. The primary determinants of macroeconomic
outcomes are:
* The interest paid on bank deposits.
* The accumulated current account
balance. [28]
* The allocation of productive resources.
* Private debt creation for profit.
[28] The net international
investment position could also be used.
The interest paid
on deposits is the cause of systemic cost-push inflation. Deposits returned to
a debtor country through asset sales to foreigners arising from an accumulated
current account deficit are a cause of demand-pull asset inflation.
Increased
productivity necessary for per capita economic growth requires new productive
investment. Overemphasis on new
non-productive capital investment such as housing distorts the productive
sector because homeowners can only service their debt through higher incomes
and higher productivity.
The confusion
surrounding the orthodox “deposit” based debt expansion of bank “reserves” and
the existing “capital” based debt expansion is historical. The banking system changed from being
“reserve” based to being “capital based” when the Basel I accord became
operative in 1992. In practice the
“reserve” system was also capital based except that the capital requirement was
limited to a fraction of the banks’ transaction account deposits. Government debt did not directly cause
“fractional reserve” debt expansion, but it did then, as now, introduce new
deposits into the banking system thereby expanding the banks’ balance sheets.
The dominant features
of the debt-based interest-bearing financial system are interest paid on
deposits and the accumulated current account balance (or net international
investment position, NIIP). Interest on
deposits creates systemic cost-push inflation in the productive sector, while
an accumulated current account deficit
(or NIIP) creates demand-pull inflation in the non-productive investment
sector caused by deposits arising from
the sale of debtor country domestic assets to foreigners. Those accumulated
current account deposits also create a deposit interest feed back loop that
adds to systemic inflation.
The paper shows the
entire modern monetary system is founded on inflation, and that there is a
systemic relationship between GDP and the monetary aggregate (M3-repos). The
rate of change of the exponential growth curves [(M3-repos) – the dynamic
production deposits My]/GDP has been linear in
This paper is based
on a debt model of the debt-based economy that shows that world debt cannot be
managed without removing unearned income from the system caused by the payment
of interest on bank deposits and by balancing each nation’s current account.
THE
REFERENCED PAPERS.
The
referenced papers :
NEW Capital is debt.
NEW Comments on the IMF (Benes and Kumhof) paper “The
Chicago Plan Revisited”.
DNA of the debt-based economy.
General summary of all papers published.(Revised edition).
How to create stable financial systems in four
complementary steps. (Revised edition).
How to introduce an e-money financed virtual minimum wage
system in New Zealand. (Revised edition) .
How
to introduce a guaranteed minimum income in New Zealand. (Revised edition).
Interest-bearing debt system and its economic impacts.
(Revised edition).
Manifesto of 95 principles of the debt-based economy.
The Manning plan for permanent debt reduction in the national economy.
Missing links between growth, saving, deposits and
GDP.
Savings Myth. (Revised edition).
Unified text of the manifesto of the debt-based
economy.
Using a foreign transactions surcharge (FTS) to manage the
exchange rate.
(The
following items have not been revised. They show the historic development of
the work. )
Financial system mechanics explained for the first time. “The Ripple
Starts Here.”
Short summary of the paper The Ripple Starts Here.
Financial system mechanics: Power-point presentation.
Return to : Bakens Verzet
Homepage
"Money is not the
key that opens the gates of the market but the bolt that bars them."
Gesell, Silvio, The
Natural Economic Order, revised English edition, Peter Owen,
This work is licensed
under a Creative
Commons Attribution-Non-commercial Share-Alike 3.0 Licence.