NGO Another Way (Stichting Bakens Verzet),
1018 AM
SELF-FINANCING,
ECOLOGICAL, SUSTAINABLE, LOCAL INTEGRATED DEVELOPMENT PROJECTS FOR THE WORLD’S
POOR
|
FREE
E-COURSE FOR DIPLOMA IN INTEGRATED DEVELOPMENT |
|||||
Edition 02 :10 February, 2013.
(VERSION EN FRANÇAIS PAS DISPONIBLE)
Summaries of
monetary reform papers by L.F. Manning published at http://www.integrateddevelopment.org.
NEW Capital is debt.
NEW Comments on the (Jaromir Benes and Michael Kumhof) Chicago Plan Revisited
Paper.
DNA of the debt-based economy.
General summary of all papers
published.(Revised
edition).
How to create stable financial systems in four
complementary steps. (Revised edition).
How to introduce an e-money financed virtual minimum wage
system in New Zealand. (Revised edition) .
How
to introduce a guaranteed minimum income in New Zealand. (Revised edition).
Interest-bearing debt system and its economic impacts.
(Revised edition).
Manifesto of 95 principles of the debt-based economy.
The Manning plan for permanent debt reduction in the national economy.
Missing links between growth, saving, deposits and
GDP.
Savings Myth. (Revised edition).
Unified text of the manifesto of the debt-based
economy.
Using a foreign transactions surcharge (FTS) to manage the
exchange rate.
(The
following items have not been revised. They show the historic development of
the work. )
Financial system mechanics explained for the first time. “The Ripple
Starts Here.”
Short summary of the paper The Ripple Starts Here.
Financial system mechanics: Power-point presentation.
![]()
This
work is licensed under a Creative
Commons Attribution-Non-commercial-Share Alike 3.0 Licence
CAPITAL IS DEBT
By
Version 4 09/02/13
For background work
see:
http://integrateddevelopment.org http://sustento.org.nz
The world is
now locked in a debt trap.
You can have debt
without capitalism but you cannot have capitalism without debt.
Nor is it possible to
have debt without interest, or usury as it has been called through much of
recorded history. All major religions ban usury because the payment of interest
transfers wealth as unearned income from borrowers to lenders. That means the major religions morally ban
debt. Despite that, those with money to start with or who could mint it or
plunder it or control it have almost always been financial and political
winners. That is still the case today.
As Stephen Zarlenga
in “The Lost Science of Money” says
“[B]y misdefining
the nature of money, special interests have often been able to assume
the control of society’s monetary system, and in turn, the society itself.” [1]
This paper will
show that in the capitalist system there must be debt to enable the purchase of
capital goods and that the amount of debt used to purchase new productive capital goods defines
productive economic output (savings=investment). Because productive debt and economic output
in the capitalist system are closely interwoven, capitalism = use of debt. No
debt, no capitalism.
The bond between
capitalism and debt does not necessarily hold in reverse. There have been
periods in history long before the advent of capitalism when communities have
gone deeply into debt and had to be rescued through debt jubilees such as the
one proposed in The Manning Plan referred
to in this article.
In this day and
age, practically all money is created as interest bearing debt by private
banks. As a result, most of the world is now locked into a debt trap and usury
is almost universal. Interest is justified by “lending risk” even though the
lenders nearly always take separate security in full for the debt.
The online
There are a lot of similar definitions that also fail to take one of the
basic features of capitalism into account: that investment money usually has to
be borrowed [2].
Monetary reform
proposals like those referred to in this paper must take all debt into account
if we are to retain some form of capitalist economy. The alternative is to
adopt some other cooperative or mutual form of economic organisation. Economic
organization evolving over the coming decades might replace capitalism as we
know it today; or it might be a hybrid of capitalism that embeds cooperative
locally distributed production and consumption, shared use of the commons for
the public good and even, perhaps, subsistence systems.
Traditional
hoarding has been replaced by deposits in banks.
Most monetary
reform proposals (with the exception of the Manning Plan )
fail to account for and manage total debt and interest rates thereby leaving
the existing capitalist economy intact. In the longer run they will accentuate
the glaring problems of income and wealth distribution, global environmental decay and widespread injustice, especially at the
cost of women, that characterize the present system.
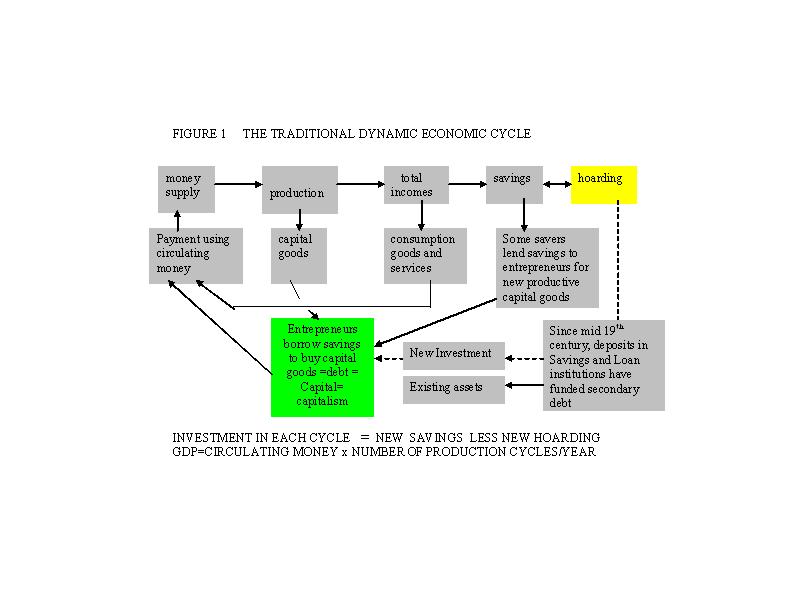
In Figure 1, if hoarding is stable, the value of consumption goods and
services and new capital goods matches total incomes. There is enough income to
“clear the market” and exchange all production. Conceptually, some people in a
traditional cash-based economy save some of their income and on-lend it to
entrepreneurs to invest to buy the new capital goods. Savings = investment is
one of the cornerstones of orthodox economics. The money supply is relatively small because most of it is
recycled with each cycle of production and consumption.
FIGURE 1 : THE TRADITIONAL DYNAMIC ECONOMIC CYCLE.
INVESTMENT
IN EACH CYCLE = NEW SAVINGS LESS NEW HOARDING
GDP =
CIRCULATING MONEY x NUMBER OF PRODUCTION CYCLES/YEAR.
Figure
1 represents a capitalist Savings and Loan model of economy and it forms the basis
of the equation Savings = Investment found in most orthodox economics
textbooks.
In
Figure 1, not all savings are invested, so that in practice new Investment =
(Savings minus hoarding). As long as the hoarded savings remain constant as a
proportion of all savings and there is no interest paid on the investments,
inflation-free growth in the Savings and Loan model shown in Figure 1 is
limited only by resource constraints and monopolistic business behaviour.
The
main change in the Savings and Loan model over time has been that for most of
history savings were physically hidden because there were no deposit banks,
whereas these days most savings are “banked”[3] as shown at the lower right of
Figure 1.
Despite appearances, the
Savings and Loan economy of Figure 1 is far from being debt-free. Assuming the
money supply itself is debt-free, as was the case when coin was the primary
means of exchange of goods and services, the total debt accumulated in the
system is the sum of outstanding loans provided by savers to entrepreneurs plus
that loaned to exchange existing capital goods. Hoarded money was taken out of
circulation (frozen) and did not begin to participate in the real economy until
Savings and Loan institutions developed. Savings and Loan deposits were on-loaned, typically to governments
and local authorities, increasing the total debt.
In the debt system the
accumulated net savings owed by entrepreneurs in Figure 1 is the sum of
outstanding productive capital
investment or, more simply the capital employed in the economy.
Capital is debt, and therefore capitalism is
debt-based.
Orthodox economics texts are
unanimous in defining investment in the equation Savings=Investment as investment
in new productive capacity as shown in Figure 1. In practice, economies
have never behaved the way orthodox economic theory would have us believe
because many people invest in non-productive and existing productive capital
assets like housing and stocks and bonds, creating a non productive “shadow
economy” now called the “investment sector” or “paper economy”.
With a constant rate of
saving, when savings are directed into non-productive investment instead of new
capital goods (productive capital), economic growth in the Savings and Loan
model of Figure 1 must stall unless new money is injected into the financial
system to compensate for the losses to the investment sector. The growth of the
investment sector means that either productive capital has to be generated from
somewhere else to compensate for the withdrawals from the productive economy or
disposable incomes in the productive economy must fall rapidly. In the present
financial system debt to feed the investment sector and prevent failure in the
productive economy is created by private banks for profit. This is discussed in
more detail later in the paper.
Payment of interest further
complicates the basic structure shown in Figure 1. Savers must have “an
incentive to invest” otherwise they would either hoard their surplus income or
spend it. In Figure 1, as long as the savings go into new productive investment
as orthodox economic theory requires, the productivity gains from the
investment should be sufficient to allow both for interest payments and for
repayments of principal. If the financial surplus from the new investment is
not enough to pay both principal and interest, the new investment project will
not proceed.
On-lending of savings for
production creates productive debt for capital goods while non-productive
investment creates secondary debt for existing assets as shown in Figure 1.
There is always a total debt equal to the outstanding loans in both the
productive and the investment sectors whether the financial system is based on
interest-bearing debt issued by private banks or whether it is based on
debt-free money.
Failure by economists to take
the debt in both the productive and the non-productive sectors collectively
into account and their insistence on viewing public debt as independent from
the total debt shows just how limited their understanding of the present
financial system is.
Periodic debt jubilees freed debtors from the
need to repay their debts.
Figure 1 suggests that debt
has been around almost as long as money has been used. There are several documented
cases of whole countries being bankrupted because the (typically
non-productive) investments they made with borrowed money failed. [4]
The debt that forced debt
jubilees thousands of years ago was probably also a kind of unproductive “pre
Savings Bank” savings and loan debt broadly similar to that shown at the lower
right of Figure 1. Peasants may have had to borrow during hard times to
maintain their existing production, especially when that production was used to
supply the lender’s “city”. The land was often held in common by a tribe or
clan. The impoverishment resulting from the payment of interest usury left
little alternative to forgiving the debt. Without the produce from the land the
“city” itself would die. That historical process may have been a precursor to
the feudalism that swept through parts of
For a long time most investment was non-productive.
Historically, interest rates
on borrowed money tended to be high. There was little productive investment
because there were few savers willing to lend and not much new technology to
invest in. Even many of the wealthy elite hoarded their money. [5] The green
coloured text box in Figure 1 shows that in a Savings and Loan system “some savers lend savings to entrepreneurs
for new capital goods”. The church(es) and nobles used their “savings”
to build cathedrals, churches, castles, manors and stately homes,
and had little incentive to invest in new technology. They represented an
extraordinarily tiny elite of land-based feudal aristocrats that persisted
until the industrial revolution transferred what the French economist Francois
Perroux called the “dominant revenue” from land to industry.[6] That was one
reason why, until the industrial revolution, lending became concentrated within a small group of
goldsmiths, money lenders and merchants.
Capitalism
has been resisted almost since it began with European colonial expansion, the
introduction of improved agricultural methods and land enclosures. From the
Levellers in England in 1648 with their manifesto “Agreement of the People” and
the Diggers of 1649, to the Chartists and their Peoples Charter of 1838,
through Marx and Engels’ famous Communist Manifesto of 1848 [7] to the Paris
Commune of 1871, the Communist Revolution in Russia of 1917 and the broad
Fabian and Labour movements of the late 19th and 20th centuries,
people have been fighting to retain ownership of the commons and (in some
cases) the means of production. The various commons movements reject free
market capitalism to a greater or lesser extent insisting that the nation’s
resources belong to everyone and should not be sold to or stolen by capitalists
for profit.
While earlier movements were
sometimes motivated by religion the later ones were based on the understanding
that the wealth generated by colonial expansion and the industrial revolution
was not being shared then any more than it is today. Whatever definition of
capitalism you choose, when “a country’s trade and industry are controlled by private owners for
profit “ (from the on-line Oxford dictionary referred to above) there is, by
definition, little room for cooperation or the common good or even for the
planet itself. The bottom lines of self interest and profit are all that
matter.
The negative effects of the enclosure of the
commons.
Marxism and the other modern
social movements grew in the cities due to urbanisation. Peasants didn’t live
in large groups and didn’t travel much. In
The capitalist enclosures of
land haven’t stopped. Ongoing resource exploitation by privileged corporations
encloses the land and the sea as much or more than the agricultural elite ever
did because they cover the whole world (or much of it). These days, knowledge
is enclosed in the form of patents over almost everything imaginable, from
individual genes that occur in everyone’s body, to the seeds and medicines we
buy. Even the airwaves, water, education and general healthcare are being
enclosed in a far more aggressive and insidious manner than the land enclosures
in earlier times. Perhaps, most importantly of all, money itself has been
enclosed as described in this paper.
In a broad sense modern
enclosures represent ongoing efforts by capitalism to monetise the commons. The
more of the world and what it contains can be monetised (and therefore counted
in GDP) the greater control capital has over the world and everything that
lives on it. In medieval times very little was monetised. Most people sold or
exchanged only what they produced over and above their subsistence needs so
relatively little money was needed. The advent of modern debt-based banking has
enabled much more of the world to be monetised. Further monetisation of human
activities and assets requires capital. Ongoing monetisation is a therefore
feature of capitalist expansion.
The arrival of Savings and Loan institutions.
As long as hoarding reduced
the circulating money supply it severely limited productive investment and
growth. When the money supply was constant, investment was dependent on the
savings income earners were willing to on-lend. The creation by statute of
“Savings and Loan” institutions like the Post Office Savings Banks in countries
such as
From the mid 19th century, the secondary
on-lending of savings deposited with Savings and Loan Institutions therefore
tended to increase debt without directly increasing the money supply. Instead
of growth of the money supply the speed at which the existing money supply
circulated increased. The Savings banks paid interest on their clients’
deposits, generally in the region of 2-3%. Savers were then “hoarding for
profit” instead of hiding it and taking it out of circulation.
The critical element of the
Savings banks and other secondary lenders such as building societies, lodges
and the like was that they often lent for non-productive purposes like new and
existing residential property. The actual construction of new houses is part of
the productive output (GDP) but new houses themselves are not new productive capital investments because they do not add any new productive capacity.
While the activity of building is
productive, the investment by the
house-buyer in the property itself is not. Housing debt is part of the grey
box “new investment” at the lower centre of Figure 1. The money used for
initial construction activities first makes a round of the productive cycle
then some of it finishes up “hoarded” in existing assets. The buyer on the
other hand usually finishes up with just a large long-term non-productive
interest-bearing debt. Productive transaction account money is used to build a
house but capital (usually debt) is
needed to buy it.
Traditionally, while wealthy
elites built vast palaces, housing was not a very important part of ordinary
family investments. In many areas of the non-industrialised world this is still
the case today. Increasing housing expectations (bigger and better houses, more
and better fittings and the like) have become an Achilles heel of the
capitalist system. The proportion of incomes committed to housing has
skyrocketed, depriving the economy of productive investment. That is why nobody
in developed capitalist economies can find a way to provide “affordable
housing”.
The interest payments on those
non-productive loans for housing had to come out of productive sector incomes as
did the principal repayments on the original amount borrowed. That is not
possible in the Savings and Loan model of the economy shown in Figure 1 without
injection of new money into the financial system because the speed of recycling
of savings could not increase quickly enough to meet the extra demand for
housing finance. The immediate result of rapidly increasing non-productive
lending for housing tended to reduce disposable incomes and deflate the
productive economy. To avoid deflation, ever more new money had to be injected
into the financial system. Instead of the same pool of money circulating
faster, some way had to be found to make the pool of money itself grow.
Companies and limited liability legislation led
to a high demand for private debt and the expansion of industrial capitalism.
One early response to the lack
of money in countries where precious metals were being used for coins was to
reduce the amount of precious metal in the coinage. [8] Another way to increase the money supply was
to create what is called fiat money in
the form of tokens or banknotes that have no intrinsic value. That has been
done at various times throughout history.
Until the British Parliament
passed the Joint Stock Companies Act in 1844, companies in
Limited
liability was not available in
The result of such limited
access to capital prior to the early decades of the nineteenth century was that
in
Notwithstanding the limitations in the Bank Charter Act, the new
legislation opened the door to a vast expansion of demand for private debt and
greater risk-taking to fund industrial expansion once James Watt’s patents [35]
on the steam engine expired in 1800. Boulton and Watt produced just 496 pumps
and engines under patent in 25 years up to 1800 and 1164 by 1824, but they gave
Inflation was negligible for six hundred years.
The introduction of steam
technology and rail led to rapid industrialisation and greater urbanisation
that reduced the excessive weather dependence of income earners nationwide.
Despite the changes in population demographics, the mass of peasants and others
who had few assets and very little money continued to hoard what little money
they had. [12] At that time, few ordinary people had bank accounts, in part
because there was no network of deposit banks where most people lived. People
had hoarded their savings for more than 500 years because there had been little
or no inflation. Many people continued to do so after the mid-nineteenth
century because there was still no inflation despite the introduction of
Savings banks in
For most of the period 1300-1900 only a relatively small proportion of
the total economic output was monetised. Except in the towns, families
generally consumed and exchanged what they produced. Moreover, while prices for
staple commodities varied wildly in the short term, there was considerable
elasticity of demand because many people could shift to cheaper alternative
products. The Savings and Loan model shown in Figure 1 coped well with the vast
increases in output through the industrial period until long after World War
II, as well as with war inflation that doubled prices in both WWI and WWII. The
legislative changes previously referred to enabled the money supply to grow and
savings to be recycled and there was relatively little interest-bearing private
bank debt. The new regional banks helped power what is called the Second
Industrial Revolution beginning in the mid 19th century as the
development of steam technology reached its peak and railways expanded.
Productive investment is the sum of all
outstanding current and past investments.
The productive investment from
the green box in Figure 1 “Entrepreneurs
borrow savings to buy capital goods =debt =Capital = capitalism” can be
accumulated over time. The total
productive investment at any time must then equal the sum of the outstanding principal
on current and past investment. The total national economic output (Gross
Domestic Product or GDP) is also a function of the circulating money supply in
Figure 1. To the extent GDP is created through productive investment rather
than monetisation of existing production there must be a direct relationship
between the outstanding productive debt and GDP at any given point of time.
[13] A good case can be made that much if not most of measured economic growth
in recent decades results from monetisation of existing non-monetised output
rather than any actual growth in GDP. Child care, elderly care, the fast food
industry and a sizable part of the healthcare industry are just a few examples
among many.
If we accept the definition of
capitalism as “an economic
and political system in which a country’s trade and industry are controlled by
private owners for profit, rather than by the state” (or something
similar), then the available productive capital is represented in Figure 1 by
the cumulative outstanding invested savings so that:
No productive investment means
no capital and no measured economic growth (the increase in GDP output measured
as shown below Figure 1) other than what arises from monetisation of existing
activities. In Figure 1, as an economy becomes more monetised the physical
money supply must be increased to avoid deflation.
The use of new fiat money came with the Bank of
In the absence of enough precious metals, notwithstanding the 19th
century gold rushes, the money supply problem and the associated supply of
productive capital were eventually resolved by creating new fiat money. When,
starting in 1690, the American colonies began one by one to print their own
fiat money (called colonial scrip) to fund their economic expansion, their
economies boomed because their money supply increased. The colonies injected
publicly-issued and owned debt-free fiat money directly into new productive
economic activity. That increased the money supply pool in Figure 1. There was
little inflation because population growth and economic development were both
high. More money and more production produced more saving and more productive
capital for investment.
In 1751 the British government
restricted the use of colonial scrip but did not ban it entirely. The
restrictions related to using the colonial bills as legal tender to repay debt
that was likely to have been lent in sterling. The British government action
caused a classic extension of the issues arising from Figure 1. It was
impossible for the American colonies to expand without new money just as it was
impossible to expand the British industrial economy without new money, even
with the use of split tally sticks. [14]
Split tallies were a form of Government fiat money that had already been
in use in
The creation of the Bank of
England in 1694 provided a new source of fiat money.[16] The actions of the
bank have often been misrepresented because government debt had been around for
many centuries. The new feature of the Bank of England was that its first loans
to the government were created as perpetual
interest-bearing debt. Subsequent debts to the bank were not perpetual and
many of them were eventually repaid. The main drawback of the Bank of England
was that it was established as a privately owned joint stock company. Its debt
was issued at interest for private profit. That represented a major change from
the tally sticks created by the government and the colonial scrip created in
America.[17] The Bank of England’s ability to create notes was strictly
regulated and its main source of income for many years aside from Government
debt was in the discounting of commercial Bills. For a time, Bank of England
notes were “as good as gold”.[18] The Bank’s main function in its early years
was providing interest-bearing loans (debt) to the government to fund
government deficits during the political instability of the 18th
century when increasing taxation was politically impossible. In 1719 it was,
however still a small lender. At a time when the government debt was £50 million the Bank of England’s share was a little over £3 million, in the same order as that held by the British East India
Company. By contrast the South Sea Company held nearly £12 million.
Individuals held the rest of the government debt either in the form of
redeemable debentures or as annuities (pensions).
The Bank of
Most government debt in the
early 18th century represented the secondary lending of individual
savings. As already mentioned, government expenditure did not necessarily directly
increase productive capital in the green box of Figure 1, though there may have
been “downstream” productive capital raising by government suppliers.
Prior to the onset of the
industrial revolution the Bank of England’s impact on the British economy was
small.
“The 18th century was a period dominated by
governmental demand on the Bank for finance: the National Debt grew from £12
million in 1700 to £850 million by 1815, the year of Napoleon's defeat at
The vast bulk of that debt was
created during the Napoleonic wars though not all of it was Bank of England
debt. Referring again to Figure 1, the new wartime money created as
interest-bearing debt was added to the money supply while existing manpower and
resources were mostly diverted from existing productive output to the
non-productive military. Unlike previous centuries, plunder was usually
insufficient to pay for war even when you were on the winning side. And unlike
the American colonies, Bank of England debt creation allowed more new money to
be circulated than was offset by population growth or increases in
productivity. Private secondary lending to the government accentuated that
effect. Prices and incomes in
The Napoleonic wars increased
government debt but they did not necessarily increase the capital base in the
green box of Figure
Industrialisation and much
greater productivity allowed the money supply to be increased while at the same
time creating substantial financial surpluses (saving) that could be recycled
into new productive capital investment and secondary investment as shown on the
right hand side of Figure 1. From 1861, as previously mentioned, ordinary
people could bank their savings in the Post Office Savings Bank where their
deposits were government guaranteed, thereby reducing hoarding and providing a
new pool of Savings and Loan investment funds [20]. Throughout this period and
later, most bank loans were business overdrafts that directly supplied new fiat
money to the productive circulating money supply (today’s productive
transaction account balances) in Figure 1.
The rapid increase of debt-based money came
with financial deregulation.
As late as
The subsequent period of
deregulation in
By 2003, the debt situation in
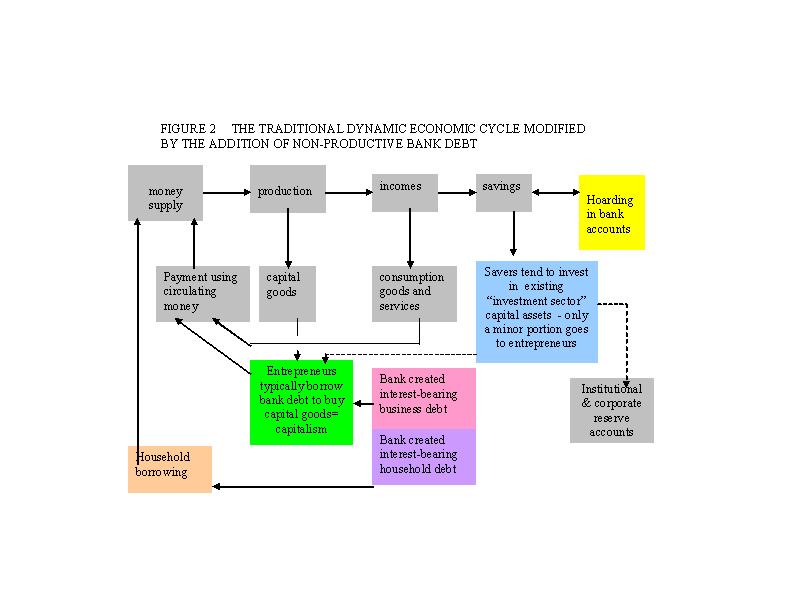
In Figure 2 existing savings
in the blue box are no longer being recycled primarily into new economic
activity as they were in Figure 1. They are instead typically channelled either
directly or through so-called institutional investors into the exchange of
existing non-productive assets. In that sense they perform the same function as
the Savings and Loan institutions previously described. To the extent the
savings end up in institutional transaction and reserve balances secondary
lending is on a one to one basis and there is no cascading effect from multiple
secondary lending.
The financial revolution was
that the savings in the savings and loan structure of Figure 1 that previously
funded new productive investment were replaced by new bank debt as shown in the
pink box of Figure 2 while at the same time the secondary non-productive debt
in Figure 1 was also replaced with new household bank debt shown in the
lavender box of Figure 2. That new bank debt for households is mainly
circulated as mortgages, student debt and credit card debt.
The
closed money supply shown in Figure 1 has been replaced by the open ended money
supply in the form of interest-bearing bank debt shown
in Figure 2.
The resulting increased money
supply created as interest-bearing debt created greatly increased capitalist
opportunities for private profit seeking, especially in the private financial
sector. That is, referring again to the French economist Francois Perroux, when
the “dominant revenue” switched from the industrial sector to the financial sector
where it has remained ever since.
The speed of circulation of the money supply
has reduced as interest-bearing bank debt has increased.
One effect of the change
appears to have been a reduction in the speed of circulation of the money
supply. It may now be less than 1 because, as shown in the yellow box of Figure
2, there is less secondary (non-bank) debt because not all bank savings
deposits are recycled into circulation. Since savings deposits are liabilities
for the banks, the banks cannot on-lend them. For practical purposes, except
for deposits on-loaned on behalf of and with the express authorisation of the
deposit holders, bank savings deposits are withdrawn from circulation, or
frozen.
Historically, the speed of
circulation of the debt-free money supply in Figure 1 may have been roughly
2.5.[24]
A reduction in the speed of
circulation of the broad money supply in Figure 2 means there is a much larger
pool of money and therefore much more profit for the financial institutions
that have created nearly all that money supply. The banking system itself has
become a parasite on the productive economy because its financial power arises
from exponentially increasing privately created interest-bearing debt. Aside
from providing day to day banking services the banking sector does not
contribute to the economy. Instead, its retained profits constitute savings in
Figure 2 that under existing banking rules it can use to create new debt at the
rate of about $12 for every $1 saved. It also passes to deposit holders
unearned interest income on their rapidly rising pool of hoarded savings
causing systemic inflation in the productive economy as described earlier. More
debt leads to more interest, more inflation, and an exponentially expanding
banking sector so that the current financial system is truly capitalism run
amok.
The profound difference
between Figures 1 and 2 is the introduction of additional interest-bearing bank
debt in the pink and lavender boxes in Figure 2.
The amounts involved are now
vast. The banks’ interest income, their claims or lending rate less their
funding or deposit rate, used to be based on a relatively small amount of bank
debt. The interest now being paid on a vastly increased volume of
interest-bearing bank debt has been the primary cause of inflation and the
boom-past cycles in recent decades.[25]
Figure 2 is simplified for
clarity. In practice, the supply of capital for business or accumulation of
funds and debt for the man in the street is not entirely limited to bank debt.
As shown by the dotted line at the centre right of Figure 2, share offerings
and issues of debenture stock and other financial paper still occur, but Figure
2 is a reasonable first approximation. These days businesses borrow from banks,
so banks supply the bulk of entrepreneurial capital as well as day to day
working funds. They add their own bank interest “spread” or margin to the
interest they pay on the resulting deposits, thereby increasing the price of
debt for their own profit. Instead of one cost of borrowing, the interest paid
on savings as in Figure 1, there are now two. The borrower must pay the cost of
interest paid by the bank to the depositor (the “savings” in Figure 2) and the margin cost of interest (the
bank spread) to the bank. As discussed above, that has set the capitalist
system (inflation, debt growth and interest) into overdrive in comparison with
the Savings and Loan model shown in Figure 1.
After the US dollar was de-linked from gold in
1971, the banking system captured the money supply for profit.
The monetary revolution was
that deregulation allowed the private banking system to capture the money
supply for profit once the US abandoned the US$ gold peg in August 1971. Once
US dollars could no longer be converted into gold, bank deregulation meant that private bank debt world-wide suddenly
became 100% fiat money with few controls on the amount of debt created.
The monetary revolution has
reinforced capitalism through increasing the money supply for profit. As
previously described, the interest on that money supply creates a feed back
loop that continually transfers wealth from debtors to deposit holders and the
financial sector, inflating both the “savings” in the investment sector and the
productive capital investment required to generate GDP.
The financial system mechanics
now force the money issued in the form of interest-bearing private bank debt to
grow exponentially to fund both non-productive investment and productive business
expansion.[26] Few people these days
borrow from modern day savings and loan institutions such as finance companies
because the interest rates they charge on their loans are typically much higher
than the interest cost of newly created private bank loans.[27] This means that
multiple on-lending of credit-based savings with a higher speed of circulation
has been replaced by the creation of new debt which conceptually circulates
just once, though there is some secondary lending in most countries that
slightly increases the speed of circulation.
Interest-bearing debt increases exponentially.
In heavily indebted countries
like
In the present deregulated
debt-based system, the amount of new debt being fed into the financial system
through the pink and lavender boxes shown in figure 2 is constrained only by
the risk-based capital requirements of the Basel Accords that set out how much
the banks can lend relative to their own capital, and by the regulatory policy
settings such as Central Bank official cash (interest) rates, designed to
manage the physical market demand for new debt. The “regulatory” settings work
very poorly because the systemic customer demand for new debt precedes any
consideration of central bank reserves.
Most of the demand for new
debt is systemic. As shown in both Figures 1 and 2, debt growth is inherent in
the debt-based financial structure through the payment of interest or usury on
loans. That is the case whether or not the debt is secondary Savings and Loan
debt as shown in Figure 1 or bank debt as shown in Figure 2. Much of that
interest is justified on the basis of measured inflation but according to
detailed papers available at the websites shown at the top of this paper, there
is a systemic feedback loop that means inflation is related directly to the interest
rate paid on deposits. Deposit interest represents “something for nothing”
because it produces nothing, becoming instead a burden on the productive
economy.
In the absence of high
productivity gains, the money supply in Figure 2 must increase by both the
principal of the new non-productive loans in the lavender box, by the interest
paid on those loans and by the new productive loans in the pink box, causing inflation in the productive
sector. That inflation creates an exponential debt spiral along with a
corresponding exponential price spiral in the productive sector. In addition,
the invested savings shown on the right hand side of Figure 2 create a parallel
exponential growth of prices in the investment sector. (See “The DNA of the
Debt-Based Economy” on the referenced websites.) Assuming interest rates are
constant, the bigger the debt in the lavender box becomes and the more new
interest is payable on it the faster the total debt load on the productive
sector will also have to increase.
Interest paid on investment
sector debt is inflationary and falls within the definition of usury because
the depositor literally gets something for nothing. The interest must be funded
by the productive economy creating an imperative for GDP growth that rests at the
heart of capitalist economic expansion.[30]
Private banks can create far more debt than
their shareholders have invested.
Both the Savings and Loan
model of the economy shown in Figure 1 and the bank debt model shown in Figure
2 generate new debt. Both of the models are capitalist to the extent that
entrepreneurs use debt to pay for productive capital investment. The former
(after savings banks were established as shown at the bottom right of Figure 1)
is a mixture of new productive debt and secondary debt while the latter is
mostly private interest-bearing bank debt loaned on the basis of the leverage
allowed by the Bank of International Settlements in Basel that sets the rules
about how much banks can lend in relation to their capital. That enables private
banks to create far more debt than their shareholders have invested in the
banks. In addition, Savings and Loan savings, particularly within the Figure 1
model, can create a cascade of secondary debt that all monetary reform
proposals need to take into account.
In Figure 1, as long as
savings keep being recycled into new
productive investment a constant level of new productive investment can be
maintained with the same money supply. In that case, the debt entrepreneurs
have to savers, the total productive capital,
increases. The same is true with multiple recycling of savings into the
non-productive investment sector to exchange existing assets.
In the bank debt system shown
in Figure 2 there is, subject to several important qualifications, a one to one
relationship between debt and capital assets, both productive and unproductive.
The qualifications include the need for the accumulated current account to be
in balance, secondary debt (such as corporate bonds in the
In Figure 1 the secondary debt
is built up through the cascading effect created by Savings and Loan
institutions through the multiple recycling of depositors’ savings as
authorised by Statute. The historical figures do not lie. Prior to World War I
inflation was low because secondary debt was relatively modest and relatively
little interest was paid on bank deposits.[31].
In Figure 2 on the other hand,
if the productive circulating money supply in the productive sector is to
remain constant the interest paid on the productive debt (the pink box in
Figure 2) must either be recycled into consumption or it must be replaced by
new interest-bearing money creation by private banks. The interest on that new
money must be added to the interest on the existing money supply and, because
all the interest has to be borne by the productive economy, the new money will
cause inflation. Inflation increased this way after World War I because interest
on the non-productive war debt had to be added to the circulating money supply
just when more hoarded savings were being banked and the rate of economic
expansion from the industrial revolution was tailing off.
The exponential increase of interest on bank
debt causes inflation.
Those inflationary pressures
have accelerated in recent decades because of the rapid endogenous (internally
self-generating) increases in bank debt caused by the systemic exponential
increase of unearned interest referred to above. Moreover, the attempts to
manage those inflationary pressures using interest rate policy have been the
direct cause of modern business cycles and financial crises. As mentioned
previously, when total debt increases, capitalism concentrates financial power
in ever fewer hands.
In summary, both the secondary
debt of the Savings and Loan structure shown Figure 1 and the bank debt shown
in Figure 2 are inflationary when interest is paid on deposits and savings are
recycled into existing capital assets instead of new productive investment.
Accumulated current account deficits in debtor countries like
The lower the interest paid the lower the rate
of inflation.
One obvious practical response
to avoid inflation is to reduce interest rates toward zero, especially deposit
interest rates.
Capitalism is inherently
inflationary because it relies on interest-bearing debt whether that debt is
bank debt as in Figure 2 or secondary debt as in Figure 1.
Successful reform proposals must stop the march
of unbridled capitalism.
With the idea of reducing
interest rates to zero, several monetary reform proposals aim at nationalising
the issue of money. Some of those proposals first appeared nearly a century ago
before inflation and exponential debt growth became a major concern. At least 5
of them involve a public monetary authority issuing all new money
interest-free, thereby removing the ability of private banks to create new
interest-bearing debt.[32] All 5 seek to undo the banking revolution of the
1980’s based on the model shown in Figure 2 and return to the model shown in
Figure 1.
There are several advantages
to the reform proposals. They eliminate new interest bearing bank debt entering
the economy. The proposals all involve a government appointed monetary
authority issuing new money debt-free and interest-free into the economy
instead of its being loaned into the economy at interest. Four of the proposals
do this initially in a sort of “big bang” debt jubilee.
In the remaining proposal, The Manning Plan, new debt-free interest free money would be
progressively introduced in the form of a universal basic income. Some of that
new money would be used to cancel existing bank debt while the rest would be
loaned back to the monetary authority at a low interest rate for recycling into
new productive capital investment.
The proposals all tacitly
accept that there will be secondary interest-bearing debt generated through
Savings and Loan facilities as shown in Figure 1, whether or not that secondary
lending is mediated by the commercial banks. However, only one of the
proposals, The Manning Plan, manages both the quantity and
price of secondary debt. The other proposals deny (both conceptually and
practically) the cascading effect of both the quantity of secondary debt and
the interest rates paid for the use of that debt.[33] Escalating
interest-bearing secondary debt can still concentrate capital just as privately
issued interest-bearing bank debt has done, though probably at a slower rate. The Manning Plan attempts to limit concentration of that
capital. The other proposals do not, despite the best intentions of their
authors.
Secondary debt must be included in the total
debt figure.
This paper has dealt with the
historical impacts of secondary lending within a fiat-based monetary system
shown in Figure 1. Further research is needed to confirm the speed of
circulation that existed in developed economies before and after the
deregulation of the 1980’s. The value of secondary debt from official records
will need to be added to the bank debt (Domestic Credit) to get the total debt.
The same can be done for the present banking system, taking great care not to
double count secondary debt. Those figures can then be carefully compared to,
say, GDP to get a Total Debt / GDP ratio, making sure that “apples are being
compared with apples”.
The advantages of good
monetary reform are better control of both the total money supply (debt-free
money plus secondary debt) and the price of that money. One without the other will not necessarily
improve the financial system. Apart from the Manning Plan,
the existing monetary reform proposals do neither because they neither manage
the amount of secondary debt nor do they sufficiently manage its price.
Productive and non-productive public and
private debt together make up the total debt.
Total debt determines the
status of the economy in a reformed financial system that allows the recycling
of a debt-free interest-free monetary base because the real money supply is the
sum of the original debt-free interest-free system deposits plus the total
secondary debt arising from recycling those deposits. Total deposits alone no longer
represent the actual money supply.
A tiny elite has now “enclosed” the total money
supply for its own profit.
Capitalism involves debt creation
of all kinds and is just one of several tools available for the generation of
economic activity in a world with little real or cash money. In recent times,
the quantity and price of debt have been abused, allowing a large pool of
unearned interest income to be accrued through usury. Due to the systemic
effects of that usury the money supply in the non-productive investment sector
has finished up in the hands of a tiny financial elite. That is characteristic
of both the Savings and Loan model of the economy described in Figure 1 and the
Debt-based model described in Figure 2. The main difference between the two
models is that in Figure 1 capitalism and power over money tend to be more
diffuse because at least some of the money supply is under public control. In
the debt-based monetary system in Figure 2 both capital and power over money
are concentrated in the hand of an ever smaller elite.
Under capitalism as defined in
this paper “a country’s trade and industry are controlled by private owners for profit”. Most of the world
is now “controlled
by private owners for profit”. The public commons are
being “enclosed” down to the genes in our bodies and the water, food and plants
we depend on for survival. For the first time in history money itself has been
“enclosed” for private profit.
At a more theoretical level
this paper has shown that Capitalism is Debt-based, where just a few control
the money supply and the debt load is borne by others. In the debt system, debt gives birth to
money. For every dollar of debt there is a dollar claim on money created
somewhere, whether or not there are bank deposits backing those claims. The
bottom line is that Capitalism has created a financial elite that accumulates
the money while leaving the corresponding debt as an everlasting burden on
society at large just as it has consumed the earth’s resources and left the
mess for society to clean up.
Monetary reform must serve the public good.
As for models for monetary
reform Alperovitz and Dubb, referring to the
“For decades, to many the only longer term
choices have seemed to be state socialism
or corporate capitalism. But new approaches may also begin to pose
new systemic ideas for a longer term progressive structural change that is both
quite American in content, and quite radical in its vision of a system beyond
the traditional models.”[34]
This
paper has shown that to be useful, those new systemic monetary reform ideas
must reverse the enclosure of the public commons and they must manage debt and
money for the public good. Managing money is not the same as managing the
amount of bank deposits. If capitalism is to remain part of our economic and
social structure, “control”, “ownership” and “profit” in the definition “control of trade and industry by private
owners for profit” will all have
to be heavily moderated in favour of the public good. With the exception of The Manning Plan , the monetary reform proposals referred to
in this paper do not do that, so that as they are presently formulated, they
are insufficient to satisfy any “vision
of a system beyond the traditional models”.
End notes:
[1] Stephen Zarlenga “The Lost Science of Money” American
Monetary Institute 2002, ISBN 1-930748-03-5, p3.
[2]
[3] Savings were often
under a hearth where they could survive a house fire and easily be recovered.
In days gone by house fires were extremely common.
[4] The Court of Phillip IV of
[5] There was large-scale hoarding in medieval
[6] The numbers of those in the nobility
(including the church) was tiny. For example there were just 13 Earls in , a couple of small villages or hamlets. Most of the
remaining 20% were knights. Elite numbers fell to about 2000 as the population
decreased during the plague years. Much later, in 1688 when the population of
England was about 5.2 million, Gregory King estimated their number to include
about 186 lords (Dukes, Marquises, Earls, Viscounts, Barons and 26 “spiritual”
lords of the church), about 600 knights, 3000 squires and 800 baronets.
Baronetcies are usually hereditary titles but do not qualify for a seat in the
House of Lords. During the 17th and 18th centuries monarchs
sold baronetcies when the crown was desperate to raise money. There are now
excellent records for the nobility from baronet up and it is possible to work
out exact numbers at any given time.
[7]
http://www.marxists.org/archive/marx/works/1848/communist-manifesto/
[8] Fiat money is like cash today where the notes
and coins have no intrinsic value. When gold and silver were used the coins
were “worth” what they bought. When the coinage was debased by reducing the
amount of precious metals in it, as famously happened in the “Great Debasement”
of Tudor England, the coins still had some intrinsic value. They were a hybrid
of precious metal and metal with little or no intrinsic value. Fiat money has
been used on and off for thousands of years in
[9] http://en.wikipedia.org/wiki/Bank_Charter_Act_1844 (downloaded 25/1/13)
Due to
recurrent crises the Act was suspended in 1846,1857 and 1866. [see [19]]
“ Under the Act, no bank
other than the Bank of England could issue new banknotes, and issuing
banks would have to withdraw their existing notes in the event of their being
the subject of a takeover. At the same time, the Bank of England was restricted
to issue new banknotes only if they were 100% backed by gold . The Act served
to restrict the supply of new notes reaching circulation, and gave the Bank of
England an effective monopoly on the printing of new notes. The Act exempted
demand deposits from the legal requirement of a 100-percent reserve which it
did demand with respect to the issuance of paper money. Until the
mid-nineteenth century, commercial banks in
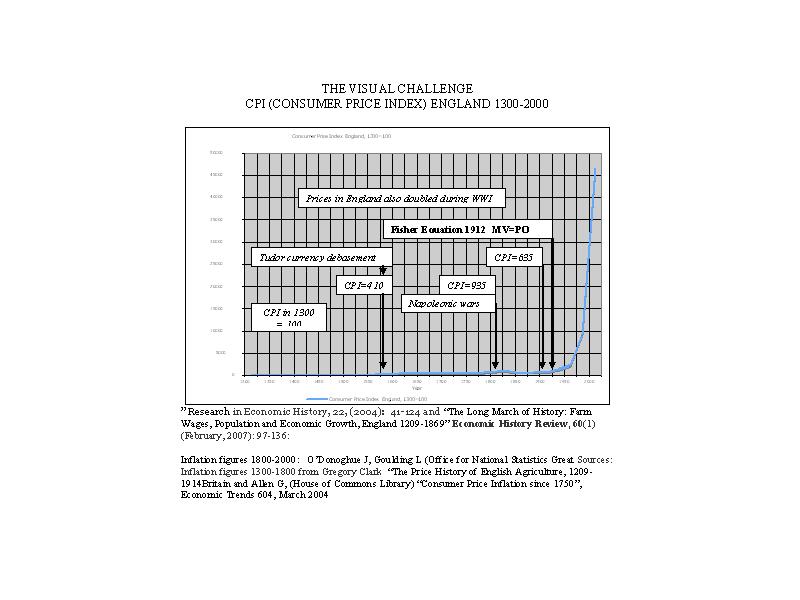
[10] (FIGURE 3) THE VISUAL CHALLENGE : THE CPI (CONSUMER PRICE INDEX)
ENGLAND 1300-2000.
[11] There is considerable research on the
population in
[12] In
[13] There is a lengthy analysis of this by
the author in the paper “The DNA of the Debt-Based Economy” published at http://www.integrateddevelopment.org/lowellDNApaper20110805.htm
The author’s estimate of GDP for more than 5 million people in England in 1300
is less than 2 million pounds.
[14] The split
tally stick was a kind of fiat money widely used for more than 700 years.
Tallies were issued by the crown (exchequer) as receipts for government
purchases and could be used in payment of taxes. They were transferable, so
stocks (the larger pieces of the split tallies) on which the details were
inscribed also circulated as money. The crucial role played by split tally
sticks from the time they were introduced in
[15] http://www.ukpublicspending.co.uk/uk_art20_uk_government_spending_from_1600_to_present.html where there is a graph from work done by Professor Gregory Clark. The spikes in the
chart are major wartime periods especially the Napoleonic wars and WWI and
WWII.
[16] See Sir John Clapham “The Bank of England” 2
volumes, Cambridge University Press, 1944 for a definitive history. Many of the
Bank’s records survive and they provide details of most of the key events from
the time it was created.
[17] The tallies were not always interest free, as
some monarchs like King Charles II sold them at a discount to raise cash.
[18] Gold convertibility was suspended during the
banking crisis of 1797 and again during WWI.
[19] http://www.bankofengland.co.uk/about/Pages/history/major_developments.aspx#4
[20] http://postalheritage.wordpress.com/2011/09/16/150-years-of-the-post-office-savings-bank/ A few cooperative banks existed long before
Post Office Savings Banks were established. One of the most famous of these is
the Monte dei Paschi di
[21] Source: New Zealand Official Year books.
[22] Source NZ Official Year Book 2004 p 438
[23] The reason for the change
was the sale of Post Bank to ANZ in 1989. It was fully subsumed into ANZ by the
year 2000.
[24] Research by the author hints that the speed
of circulation in medieval
[25] According to Friedman and Schwartz in their
monumental book “A Monetary History of the
[26] This assumes for simplicity that all the
domestic debt funding and accumulated current account deficit has been returned
to the debtor country in the form of reverse capital flows. (And vice versa for
accumulated current account surpluses).
[27] Though there are well developed secondary
debt markets in a few developed countries like the
[28] The Net Foreign Investment Position can also
be used. While the burden of the accumulated current account deficit falls
ultimately on households, the major financial causes of
[29] Until recently the
[30] The methodology and management of interest
rates is beyond the focus of this paper, but they are supposedly managed by the
central bank. In
[31] In
[32] They are:
- The Social Credit Movement founded by Major Douglas in the
1920’s.
- The Chicago Plan proposed by Fisher and Simons and supported
by Friedman that was recently revived in an IMF paper “The Chicago Plan
Revisited” by
Kumhof and Benes.
- The “Bank of England – Creation of credit Act” promoted by
Positive Money in the
- The “National Emergency Employment Act” (NEED Act) promoted by
the American Monetary Institute (AMI) in the
- The Manning Plan
proposed by the author of this paper
(available at the websites referred to at the beginning of this paper.)
[http://www.integrateddevelopment.org/manningplan20120913.htm ]
[33] The AMI NEED Act does cap some secondary
debt interest rates at 8% including bank costs but that is still more than
sufficient to create massive systemic inflation.
[34] http://www.commondreams.org/view/2013/02/01-9 1/2/13
[35] http://mises.org/daily/3280 (James Watt)
ACKNOWLEDGEMENT
The author is greatly indebted
to Terry Manning of the Netherlands NGO Bakens Verzet for his careful editing
of this paper.
Summaries of monetary reform
papers by L.F. Manning published at http://www.integrateddevelopment.org.
NEW Capital is debt.
NEW Comments on the IMF (Benes and
Kumhof) paper “The Chicago Plan Revisited”.
DNA of the debt-based economy.
General summary of all papers
published.(Revised
edition).
How to create stable financial systems in four
complementary steps. (Revised edition).
How to introduce an e-money financed virtual minimum wage
system in New Zealand. (Revised edition) .
How
to introduce a guaranteed minimum income in New Zealand. (Revised edition).
Interest-bearing debt system and its economic impacts.
(Revised edition).
Manifesto of 95 principles of the debt-based economy.
The Manning plan for permanent debt reduction in the national economy.
Missing links between growth, saving, deposits and
GDP.
Savings Myth. (Revised edition).
Unified text of the manifesto of the debt-based
economy.
Using a foreign transactions surcharge (FTS) to manage the
exchange rate.
(The
following items have not been revised. They show the historic development of
the work. )
Financial system mechanics explained for the first time. “The Ripple
Starts Here.”
Short summary of the paper The Ripple Starts Here.
Financial system mechanics: Power-point presentation.
"Money
is not the key that opens the gates of the market but the bolt that bars
them."
Gesell,
Silvio, The Natural Economic Order, revised English edition, Peter Owen,
![]()
This work is
licensed under a Creative
Commons Attribution-Non-commercial-Share Alike 3.0 Licence.