NGO Another Way (Stichting Bakens Verzet), 1018
AM
SELF-FINANCING, ECOLOGICAL,
SUSTAINABLE, LOCAL INTEGRATED DEVELOPMENT PROJECTS FOR THE WORLD’S POOR.
|
FREE E-COURSE
FOR DIPLOMA IN INTEGRATED DEVELOPMENT |
|||||
Edition 01 : 24 June, 2011.
Edition 02 : 08 August, 2011.
Edition 03 (revised) : 12
September, 2011.
Edition 05 : 09 February,
2013.
(VERSION EN FRANÇAIS PAS
DISPONIBLE)
Summaries of
monetary reform papers by L.F. Manning published at http://www.integrateddevelopment.org
NEW Capital is debt.
NEW Comments on the IMF (Benes and Kumhof) paper “The
Chicago Plan Revisited”.
DNA of the debt-based economy.
General summary of all papers published.(Revised edition).
How to create stable financial systems in four
complementary steps. (Revised edition).
How to introduce an e-money financed virtual minimum wage
system in New Zealand. (Revised edition) .
How
to introduce a guaranteed minimum income in New Zealand. (Revised edition).
Interest-bearing debt system and its economic impacts.
(Revised edition).
Manifesto of 95 principles of the debt-based economy.
The Manning plan for permanent debt reduction in the national economy.
Missing links between growth, saving, deposits and
GDP.
Savings Myth. (Revised edition).
Unified text of the manifesto of the debt-based
economy.
Using a foreign transactions surcharge (FTS) to manage the
exchange rate.
(The
following items have not been revised. They show the historic development of
the work. )
Financial system mechanics explained for the first time. “The Ripple
Starts Here.”
Short summary of the paper The Ripple Starts Here.
Financial system mechanics: Power-point presentation.
THE
SAVINGS MYTH
By
We
are almost blind when the metrics on which action is based are ill-designed or
when they are not well understood.[1]
Key Words: accumulated current account deficit, CPI, current
account deficit, debt, debt model, debt growth, deposit interest, domestic
credit, exponential debt growth, E-notes, Fisher equation, foreign debt,
inflation, national accounts, NFL, revised Fisher Equation, saving, savings,
SNA, systemic inflation, unearned income.
|
CONTENTS: 01. EXECUTIVE SUMMARY. 02. BACKGROUND. 03. THE SYSTEM OF NATIONAL
ACCOUNTS. 04. THE CURRENT ACCOUNT
PROCESS. 05. CAPITAL FLOWS AND THE
PURCHASE OF CAPITAL GOODS. 06. CHANGES IN INVENTORIES
(STOCK). 07. “SAVINGS” THAT DO NOT
QUALIFY UNDER THE SYSTEM OF NATIONAL ACCOUNTS. 08. RE-EVALUATING AND
CORRECTING NET SAVINGS AND RELATED ENTRIES IN THE NATIONAL ACCOUNT. 10. CONCLUSION. 11. BIBLIOGRAPHY AND
ACKNOWLEDGEMENTS. APPENDIX 1. DERIVATION OF
SAVINGS FUNCTION FROM THE STEM OF NATIONAL ACCOUNTS. APPENDIX 2. COMMENT ON THE
NEW ZEALAND SAVINGS WORKING GROUP (SWG) REPORT TO NEW |
Page |
01. EXECUTIVE SUMMARY
This paper reviews the nature of saving in a
debt-based economy and the System of National Accounts (SNA) used
internationally to represent national economic outcomes.
The most important account in
the SNA system [2] is the Gross domestic product (GDP) and expenditure
account. In
[1] Stiglitz et al 2009 p. 9.
[2] See United
Nations, 2009. The appendices set out the order of the SNA
tables.
A
trade surplus swaps domestic consumption goods and services for foreign capital
assets.
The “gross operating surplus” used
in a country’s national income and outlay account (Table 1.2 of the national
accounts) must reflect the final net figure from the Gross domestic product and
expenditure account after taking into account the purchase of foreign assets to
satisfy the balance on external goods and services.
The forced purchase of foreign
capital assets resulting from a positive trade balance reduces the real growth
in the domestic economy of the exporting country compared to what it otherwise
would be, because there are fewer consumption goods and services left to buy
there and no corresponding domestic incomes to buy them with.
A
positive balance of trade therefore tends to be a negative domestic growth
factor in the exporting country at large and a positive growth factor for that
country’s business interests.
An increase in the trade
balance should be deducted from the
presently measured domestic growth of the exporting country because it does not
properly reflect the real growth of its domestic economy. There is no such
thing as an “export-led recovery” because a positive balance of trade does
nothing in aggregate to improve the well-being of consumers in the exporting
country. Potential economic growth in the exporting country is swapped
for foreign capital assets that narrowly benefit business interests instead of
those of the wider community. The national accounting effect is to reduce
domestic credit and deposits below what they would otherwise have been.
The “Saving” presently shown
as a residual in the National income and outlay account [3] of the National
accounts prepared under the international System of National Accounts is a
myth. It does not satisfy the fundamental orthodox economic principle of
Saving equals Investment where
“investment” is defined as productive investment in new capital goods.
[3] For example Table
1.2 of the New Zealand National Accounts published by the NZ Department of
Statistics.
The debt model referred to in the
introduction (Section 2) of this paper shows that the production and purchase
of capital goods takes place within the productive sector of the economy.
The process is discussed at length in Section 5 of this paper and illustrated
at Figure 2. To comply with orthodox theory the SNA National income and outlay
account must comply with equation (1) in the paper, namely:
S = DI – C
(1)
Where:
Saving S in equation (1) equals the transfer of productive
income from income earners to the purchasers of new capital goods within the
productive economy,
DI is disposable income from the National income and
outlay account, and
C is final consumption expenditure also taken from the
National income and outlay account.
For S to satisfy equation (1)
it must equal gross capital formation as stated in the SNA less the
principal repayments being made on existing capital goods. S is not a residual as the present national
accounts claim. It is a real number based on the sale price of
capital goods produced over any period of time and the principal loan repayment
schedules required by lenders during the same period. When the Saving S, as it
is defined above, is entered into the “use of income” side of the National
income and outlay account, the account, in its present form, no longer
balances.
The National income and outlay account fails to
balance for four reasons:
(a) because it includes the current account balance on
one side only of the account, and
(b) it includes the full value of inventory changes that have little real value,
and
(c) it is based on depreciation (a wealth statistic
used for taxation purposes) instead of the financial cash flow in the economy
represented by principal repayments, and
(d) the residual gross
operating surplus is the figure from the gross domestic product and expenditure
account before taking account of foreign assets purchased abroad to satisfy the
balance on external goods and services as discussed above.
Taking each of the four reasons in turn:
(a) The first reason.
This paper shows that the “balance on the external current account” (CA) is
primarily a capital account item even though it forms part of the National
income and outlay account of the SNA. CA includes the balance on external goods
and services, net compensation of employees from the rest of the world, net
investment income from the rest of the world and net current transfers from the
rest of the world [4]. If the current account balance CA is included as national
income on the income side of the national income and outlay account, the same
sum must be recorded as “non-productive investment abroad in capital goods” in
the “Use of income” side of the account because CA is not Saving in the
orthodox sense of equation (1). The corresponding entries
required on each side of the national income and outlay account are positive
for creditor countries and negative for debtor countries. This conclusion is
analysed in Section 4.
In a creditor country with a current
account surplus, consumption goods are consumed offshore and there may also be
interest income and profits remitted to the creditor country from its debtor
countries. The resulting incomes are spent by the productive sector of the
creditor economy to purchase capital goods offshore to satisfy the foreign
exchange mechanism. This leaves less of the gross operating surplus shown on
the gross domestic product and expenditure account of the creditor country for
new gross fixed capital formation as already described above, effectively reducing total incomes there.
In a debtor country with a current
account deficit, the surplus imported consumption goods are consumed through the creation of new domestic debt. Interest
payments and other remittances made by the debtor country through its current
account are also funded through the creation of new domestic debt. The deposits
arising from that debt are used to pay for the surplus consumption, interest
and other remittances. The payments are then returned to the debtor
country in exchange for capital goods or claims on capital goods that can
include commercial paper such as loans to banks in the debtor country.
Those return “capital flows” satisfy the foreign exchange mechanism set out in
Section 4 of this paper. The domestic debt of the debtor country increases
[5]. There is a corresponding increase in its domestic deposits. This
increase excludes foreign exchange loans to debtor country banks that do not
appear as M3 deposits in debtor country bank accounts [6]. If the net
consumption, interest and profit paid by the debtor country to its foreign
creditors is deemed to be negative national income in its national income and
outlay account, there must be a corresponding entry on the “use of income” side
of the account to reflect the loss of the debtor country’s capital goods. All
that has happened is that the debtor country economy has exchanged some of its
existing capital goods for consumption goods and to cover other remittances it
makes to fulfil its foreign currency debts. These exchanges take place outside of its productive economy.
[4] For example
: As set out in Table 1.4 of the New Zealand National Accounts published
by the NZ Department of Statistics.
[5] As is evident from
the reconciliation of monetary and credit aggregates, for example, Reserve Bank
of New Zealand Table C3 “Monetary and credit aggregates (NZ$ million)”.
[6] Refer, for example
to New Zealand Reserve bank Table C3 “Money and credit aggregates (NZ$
million).
(b) The second reason. The change in the
valuation of inventory in the gross domestic product (GDP) and expenditure
account of the National Accounts is discussed in Section 6. Inventory (other
than “stable” inventory needed to maintain reasonable continuity of supply to
consumers taking into account population growth and inflation) has little
residual value. This is because it must either be discounted at a cost to
future sales or it must lead to a reduction in future production. Either
production levels are maintained and goods and services are sold at a lower
price, or the price is maintained and the quantity consumed is lower, as
predicted from the Fisher Equation of exchange [7]. In most circumstances a
growing inventory represents a future “cost” rather than an “investment”, which
is one reason inventories are kept to a minimum in modern industrial
management.
Much of the change in
inventory “value” now registered in the SNA accounts is being “double counted”
in the GDP. This is because the corresponding incomes that would have been
needed to buy the inventory have either been siphoned off into
non-productive “saving” (referred to below) or they have been used to subsidise
other consumption prices. Non-productive “saving” and subsidies for consumption
prices use up the incomes that would have purchased the spare inventory.
When that is properly taken into account, current production [8] has not
been discounted enough to clear the market. As a first approximation, the value
of the change in inventory has been set at zero for the purposes of this
paper. That reduces the residual “Gross operating surplus” in the Gross
domestic product and expenditure account [9], and, therefore the National
Disposable Income (DI) [10] by the same amount.
(c) The third reason. To align with basic
theoretical principles of saving and investment, “Consumption of fixed capital”
in the national income and outlay account [11] must be replaced by the cash
flow figure “repayments of principal”. The cash flow figure represents the
outstanding loan debt on existing capital goods that is retired during the
period to which the account refers.
(d) The fourth reason. The
“Balance of external goods and services” is part of the current account
balance. Section 4 shows that the surplus consumption goods making up the
balance on external goods and services are “swapped” for capital goods. When
the current account items are placed together on the “income” side of the
National income and outlay account an equal and opposite entry “non-productive
investment abroad in capital goods” must be placed on the “use of income”
side of the National income and outlay account. In that case, a new entry “less the balance on
external goods and services” is required on the income side below the existing
entry “gross operating surplus”.
Inclusion
of the “Balance of external goods and services” in the SNA calculation of GDP
means that the economic growth figures provided in official statistics are
invalid. This is because they reflect
a change of foreign ownership abroad rather than a change in the domestic
economy. They are unsuitable as a basis for deciding domestic
economic policy. Figure 7 suggests that domestic growth in
The changes
proposed in this paper bring the “use of income” and “income” sides of the
National income and outlay account [12] into alignment as
discussed in Section 8 of the paper. In summary it becomes:
Use of income :
= Final consumption C.
+ Purchase abroad of non-productive capital
investment goods (=CA).
+ Saving for productive investment S.
(18)
Income :
= GDP
+ Current account balance (CA).
less the balance on
external goods and services.
less repayments of
principal on outstanding productive investment.
(19)
Figure 7 provides a comparison
of the National Disposable Income (DI) corrected as proposed above and the DI
as shown in the existing national accounts for
The SNA National capital
account [14] needs to be restructured too. The capital assets bought by a
creditor country to settle its current account imbalance are added to its
“capital accumulation”. They are funded by new debt in the debtor country. The
“finance of capital accumulation” in the SNA capital account [15] becomes almost meaningless. Domestic
growth is swapped for foreign assets.
[12] Ibid Table 1.2.
[13] Figure 7 is indicative
and subject to recalibration. It is presently based on principal repayments
being 1.23 x the depreciation figures given in the existing National accounts
except for 1990-1993 when 1.6 x depreciation has been assumed and from 2001 to
2006 when 1.1 x depreciation has been assumed. Figure 8 hints that the model DI
curve should be above the official DI curve, but it is not.
[14] See for example
Table 1.3 of the New Zealand National Accounts published by Statistics New
Zealand.
[15] Ibid Table 1.3.
Assets purchased by a creditor
country from a debtor country are already “fully paid” by the creation of new
debt in the debtor country. If double entry bookkeeping is retained in the
capital account, the entry on the capital accumulation side would need to be
“Purchase abroad of non-productive capital investment goods” and the entry on
the finance of capital accumulation side would be an equal sum labelled
“Sale of surplus consumption goods and receipts of interest, profits and other
current transfers on the current account”.
Conceptually, therefore,
there is no such thing as foreign debt. There is only foreign ownership.
A debtor country with an accumulated current account
deficit is “owned” by foreigners in the proportion the total deficit bears to
the debtor country’s productive asset base [16].
Saving trends are discussed in
Section 5 and the key findings are presented in Figures 4 and 5. Figure 4 plots
principal repayments as a proportion of gross capital formation (GCF) in
Section
5 shows that the decline in Saving for productive investment in
A primary cause of the decline
in Saving for productive investment is the rise of average depreciation rates
over time. This is shown in Figure 4. According to the second order polynomial
trend line of Figure 4, capital repayments have increased in
The
dire conclusion from this paper is that Saving for productive investment and
real GDP growth as measured using the international System of National Accounts
cannot be restored to modern developed economies unless the protocols around
depreciation are altered, bank lending polices and regulations reviewed and the
serious distortions in the SNA records themselves are corrected.
The final major issue of this
paper, discussed in Section 7, relates to the nature of “saving” that
does not qualify as Saving S for productive investment. Examples of this kind
of “saving” in
The productive economy is
self-cancelling. GDP is produced using only a small amount of debt. The debt used for
production is estimated to be less than 5.5 % of GDP in
[16] A wealth base
could also be used depending on what ownership comparison is being made.
[17] For example Table
1.2 of the New Zealand National Accounts published by Statistics New Zealand.
[18] Details of these
funds including their annual reports are readily available by searching “NZ
[name of fund]” on the internet.
[19] See paper “The DNA of the debt-based
economy.” The debt issued to generate the GDP has increased as a proportion
of GDP over time as the cash-based economy has been replaced with a debt-based
economy.
[20] See also Kerin, 2009.
“Savings” programmes
like the “Cullen” Fund and the Kiwisaver scheme in
(a) Deposits in the form of unearned income paid as interest on
banking system deposits (Ms in the debt model referenced
in this paper)
(b) Deposits arising from the sale of domestic assets to foreigners (Dca in the debt model referenced
in this paper)
(c) Increased consumer debt where consumers are
enticed to maintain demand by borrowing beyond their incomes such as by the
systematic transfer of productive incomes into speculative non-productive
“investment” in the so-called “investment” sector or paper economy [21] (Db in the debt model referenced in this paper)
The manifestations of such “saving”
are wage stagnation, higher unemployment and recession, and increasing
inventories caused by lack of consumer demand.
The “investment” sector relies
for financial returns on unearned income and asset
inflation. Non-productive “savings” are the diametric opposite of the
needs of a healthy productive economy. They are parasitic. Since they cause a
transfer of funds from the productive economy to the speculative paper economy
they should really be included as negative items in the national income and
outlay account [23].
The
combination of the structural decline in real productive investment, harmful
“saving” and systemic error in the SNA itself is lethal to productive economic
activity in industrialised countries. It shows the extent to which the savings
myth has destroyed monetised human economic potential worldwide.
[21]
See previous papers by the author for further information: Financial system mechanics explained
for the first time “The Ripple Starts Here” and The interest-bearing debt system and its
economic impacts.
[23] Section 8 of this paper does not yet go so far, but it does propose to
include relevant capital items in the national capital account.
02.
BACKGROUND.
The theoretical work on which this paper is based can be
found at http://www.integrateddevelopment.org
There are now seven papers and ten documents altogether :
00. General summary of all papers published.
01. Financial system mechanics explained for the first time. “The Ripple
Starts Here.”
02. How to create stable financial systems in four
complementary steps.
03. How to introduce an e-money financed virtual minimum
wage system in New Zealand.
04. How to introduce a
guaranteed minimum income in New Zealand.
05. The interest-bearing debt system and its economic
impacts.
07. The DNA of the debt-based economy.
08. Manifesto of 95 principles of the debt-based economy.
09. Unified text of the manifesto of the debt-based
economy.
Papers 2, 5 and 7 are
especially relevant to this paper. Click on the links to access them. All
the work is covered by Creative Commons Attribution Non-commercial Share-alike
3.0 licence. This means it is free for access, download and use on a reciprocal
basis. The debt model used in this work is developed at “The interest-bearing debt system and its economic impacts”. That paper expands the Fisher equation of
exchange to allow for the effects of using interest-bearing debt in the world’s
financial systems.
Inflation in the debt model is
systemic and is directly related to deposit interest rates. The present model
calibration shows the inflation rate in
New Zealand is half the average deposit interest rate before adding the
recent one-off 2.5% GST increase (which is tax, not inflation, even though it
appears in prices) and provided wages and incomes are increasing with inflation
and capital inflows are not used for consumption. If interest rates rise, systemic inflation rises with them, but the
real effect on prices during recessions is masked by business discounts. Measured consumer price inflation falls when
interest rates are raised because the higher interest rates “kill” the economy,
not because they kill systemic inflation.
Paper 5 How to create stable financial
systems in four complementary steps includes a proposal to use
electronic cash or E-notes to achieve “quantitative easing”, enabling
real earned savings to accumulate. Issuing E-notes is exactly what governments
do when they purchase bonds from the banks except the bonds bear interest and
have to be repaid with new debt. As set out in the following sections of this
paper, the existing financial system based on interest-bearing debt does not
allow for aggregate non-productive saving
In the debt model, GDP arises
from the flow of the productive transaction deposits My used by the productive sector
to produce goods and services, multiplied by its speed of circulation Vy. The pool of transaction deposits My that funds the productive sector in the debt model
must grow if the GDP is to increase. Without the issue of new
debt or interest-free E-notes there can be no new GDP. Over the past
several decades New Zealand’s debt has been growing much faster than its GDP
because there is a structural transfer, in the form of unearned deposit
interest, of productive incomes to the unproductive “investment sector” or
paper economy. The same has been happening almost everywhere else in the
world. The debt model shows how that extra debt arises and how it fuels
the non-productive investment sector causing asset bubbles. The use of
interest-free E-notes on a wide scale instead of debt would allow interest
rates to be set at very low levels, stopping asset bubbles and bringing the
unproductive investment sector expansion into line with that of the productive
economy. Using E-notes is more efficient than using debt. Overall, far
LESS debt and fewer corresponding bank deposits would be needed using E-notes
than are needed now. This is because the pool of debt Ms supporting the
un-productive investment sector would grow much more slowly than it has grown
in the past.
In relation to “saving” in the
System of National Accounts (SNA), a primary ‘bible” for measuring asset prices
and depreciation is the OECD Manual 2009 “Measuring Capital”, 2nd
Edition”[24]. The general purpose of both the SNA and the Manual relates to
measuring wealth to
assist in the calculation of financial returns. That is likely to
be why the SNA uses “consumption of fixed capital” based on depreciation
schedules. No matter how refined those schedules are, they cannot
represent the monetary flows contemplated by the National income and outlay
account of the SNA. This causes an
inherent contradiction in the National Accounts [25]. Lack of
understanding of the nature of saving in a debt-based financial system is
widespread throughout economic literature[26]. This is a core issue of
this paper and especially its Section 4. Figure 5 shows how catastrophic the
unjustifiable use of depreciation in the SNA has been in slowing economic
growth.
A main source for measurement
of the Balance of Payments and International Investment Position is the
“Balance of Payments Manual” Edition 6 (BPM6) published by the International
Monetary Fund (IMF) in 2009 [27].
In
In practice, according to the
debt model, deposits that migrate outside the productive economy must, in
aggregate, be funded either from new bank debt or a decrease in consumption
demand. Otherwise the purchase of new productive capital goods cannot be
completed within the productive sector as the debt model requires [28].
[24]
Especially Ch 5 “Depreciation or Consumption of Fixed Capital”.
[25] This becomes apparent as early as page 10 of SNA 2006, United Nations,
2008 where par. 1.63 says: “The accounting rules
and procedures used in the SNA are based on those long used in business
accounting” while in the very next paragraphs it says that where there is a conflict
between business accounting and economic theory, economic theory will take
precedence. However, in practice, the National Accounts do NOT give
precedence to economic theory, otherwise they would not be faulty as this paper
demonstrates.
[26] Ideological
“capture” of economic debate at some major universities and financial
institutions may have contributed to this.
[27]
The New Zealand Statistics Department is still using the previous edition
(BPM5).
[28] See later
discussion especially Section 7.
03. THE SYSTEM OF NATIONAL ACCOUNTS.
Simon Kuznets worked widely on
economic measurement and received a Nobel prize for his efforts in 1971. He is
one of the fathers of the System of National Accounts (SNA) in use throughout
the world, especially the parts relating to national income[29].
The work of Kuznets and others
developed largely from the pioneering work of Irving Fisher [30] and was
extensively used during and after World War II to help direct economic
resources to where they would be most productive. The essence of the SNA is to
measure both the income side and the expenditure side of monetised economic
activity and compare the two.
Basic economics texts give
remarkably little space to saving. Baumol and Blinder [31] for example devote
only a couple of pages to it. At the most basic level they define Saving S
as the difference between disposable income (DI) [32] and consumption
expenditure C [33]. In the SNA, saving is a residual number obtained by
measuring disposable income DI and consumption C, though DI itself also
contains another residual
called the gross operating surplus which is used to balance the income side of
GDP.
S = DI – C
(1)
This is confirmed by the section
on “use of national disposable income” that forms part of the national accounts
of most of the worlds’ nations [34]. Baumol and Blinder write:
“The economy will reach an equilibrium at full employment only if the
amount that consumers wish to save out of full-employment incomes is precisely
equal to the amount that investors want to invest”[35].
According to Baumol and
Blinder Savings S=Investment I “always” (Italic in text p181)
[36]. Most “modern” basic economics texts including Baumol and Blinder
provide circular flow diagrams of the economy that stress this interpretation.
[29] Among his major works: National
Income and Capital Formation, 1919–1935.
[30]
Fisher’s well-known equation of exchange is revised in Manning op cit. to take
into account the modern debt-based financial system.
[31]
For example, “Economics Principles and Policy”, William J. Baumol and Alan S.
Blinder, 4th Edition Harcourt Brace Jovanovich, 1988.
[32] (National) Disposable Income (N) DI is not the same as Gross Domestic
Product (GDP). The two are linked in the System of National Accounts (SNA) by
the relationship: (N) DI = GDP+ net property and entrepreneurial income from
the rest of the world -consumption of fixed capital (depreciation) + net
current transfers from the rest of the world.
[33] Baumol & Blinder op cit p 155.
[34]
For example Statistics
[35] Baumol & Blinder op cit p 177.
[36]
The statements fail to consider the mechanics of the financial system such as
credit creation and retirement, growth, debt servicing and unearned income and
associated speculative investment: and they simply assume equilibrium theory.
Baumol and Blinder are also explicit about the
definition of investment:
“As defined
in the national income accounts, investment includes only newly produced
capital goods, such as machinery, factories, and new homes. It does not include
exchanges of existing assets.” (emphasis in text). [37]
Those newly produced capital
goods are produced and sold in the marketplace just like goods and services for
consumption (As set out in Figures 1 to
3 and Section 7, and in the paper “The DNA of the debt-based
economy.”
For Saving to equal
(productive) Investment in the SNA, it must, according to orthodox economic
theory, arise from production incomes when there is “full-employment” in the
economy. The theory provides little guidance on what happens in the
absence of “equilibrium” or “full-employment”.
The SNA National Income and
Outlay account also includes “investment income from the rest of the world,
net” and “current transfers from the rest of the world, net” [38] that
together make up the Current Account surplus CA if they are positive and
Current Account deficit if they are negative.
The derivation of the Savings function from Table 1.1
and Table
Saving S (net) =
Current account surplus (CA)
+ Gross capital formation
(including increase in stocks) [39].
- Consumption of fixed
capital (depreciation).
+ Statistical discrepancy
[40]
(13)
The SNA Saving S formulated that way fails to satisfy
the orthodox economic conditions for saving in at least four respects [41].
[37] Baumol & Blinder op. cit. p. 159.
[38] NZ
National Accounts Table 1.2.
[39]
Gross capital formation is the same as Investment. Increase in stocks is also
usually treated as investment.
[40] Required
because of errors in the GDP production and expenditure estimates even though
the operating surplus is itself already a residual.
[41] In
the SNA itself, at United Nations, 2008, par. 9.28, p.183 saving is defined a
little more loosely: “Saving
represents that part of disposable income (adjusted for the change in pension
entitlements) that is not spent on final consumption goods and services.” However,
the economic compliance failures discussed in this paper still apply.
First, current account surpluses
are not, for the most part, formed of saving as defined by orthodox theory.
This is despite their being represented by new debt in the debtor country and
by an equivalent amount of foreign assets in the creditor country. For details
on the current account process see section 4 of this paper. In practice,
current account surpluses in creditor countries result in non-productive
“saving” outside of the domestic economy. The “saving” is funded by new debt in
the foreign debtor economies. The new debt in the debtor countries is created
outside of their domestic productive economies.
Secondly, depreciation is not
a cash flow and so cannot relate to income and outlay. For details see section 5
of this paper on capital flows and the purchase of capital goods. United
Nations (2008) at par. 6.240 on p. 123 makes clear that “consumption of fixed
capital” in the SNA is meant to reflect the residual economic value of an
asset, as distinct from its accounting depreciation. It is unclear how the
residual economic value of an asset can be calculated unless actual repayments
are taken into account [41] [42]. Whatever “consumption” allowance is
made, it still does not represent a financial flow as the SNA itself insists is
necessary. The national income and outlay account is, by definition, about
income and expenditure, not about wealth.
Thirdly, while increases in stock are produced, they
are neither investment nor saving because they have little net residual value.
For details see section 6 of this paper on changes in inventories (stocks)
[44].
[42] Refer United nations, 2008, par. 248-251 for further clarification.
[43] United Nations, 2008 (SNA) at par. 10.25 p.198 defines “consumption of capital: Consumption of fixed capital is the decline, during
the course of the accounting period, in the current value of the stock of fixed
assets owned and used by a producer as a result of physical deterioration,
normal obsolescence or normal accidental damage”. This
is itself evidently a wealth related definition rather than a dynamic income
flow.
[44] This applies
notwithstanding the valuation of stocks in the SNA, United Nations, 2008 par.
124-125, p.208
Fourthly and above all, Saving S is defined in Table
1.2 of the National Income and Outlay account to be Disposable Income less
Consumption (equation 1) as orthodox theory requires. However, in its present
form the National income and outlay account as a whole prevents Saving S from
conforming to the definition required by orthodox theory.
The existing sequence and
format of the tables making up the national accounts under the System of
National Accounts can be readily accessed at Annex 2 (from page 561 onward) of
the SNA protocol:
http://unstats.un.org/unsd/nationalaccount/docs/SNA2008.pdf
.
04. THE CURRENT
ACCOUNT PROCESS.
While the current account (CA)
can be interpreted as a form of “saving” for the creditor country, it does not automatically follow
that a CA deficit can be considered a “negative saving” in the debtor
country. “Negative saving” is extremely difficult to visualise. Borrowing
to settle the foreign exchange transactions on the current account deficit is, by
definition, “dis-saving” because it results in the sale of domestic productive
assets to foreigners except to the
extent domestic deposits arising from the sale of those productive assets are
reinvested in new productive assets.
Some of those deposits could
potentially qualify as productive SNA investment but most do not. That is
not quite the same as in equation 13. The SNA appears to be mixing productive
sector transactions with non-productive investment sector ones; thereby
confusing income with wealth.
Foreign ownership
of the assets of debtor countries is not always made public there. Its
consequences are not widely advertised and its serious economic impact is
poorly understood in the wider community.
New deposits from the creation
of extra debt in the debtor country are not strictly Saving in the creditor
country because they do not increase productive investment there. In the
absence of the exchange (the swaps), the creditor country would face a quantum
of inflation in its productive sector equal to its current account surplus.
The current account process is
shown in Figure 1. Arguably, neither the debtor country nor the creditor
country gains from current account imbalances. The creditor country spends its
deposits from the sale of its surplus production and other remittances earned
abroad to buy an equal “value” of assets from the debtor country. That
increases the creditor country’s nominal wealth but does little for its
domestic economy. If it did not purchase assets abroad there would be too
much income left in circulation in the creditor country for the purchase of the
goods and services left over there after exporting its production surplus. That
would be inflationary, and seems to be one origin of the widespread
misapprehension that creditor countries “export” inflation [45]. To avoid
that, the surplus income must be re-invested abroad. That re-investment affects
the creditor country’s capital account rather than Saving on its national
income-outlay account. In
practice exporting countries merely maintain their purchasing power status quo
by means of the foreign exchange transactions. Those transactions do, however,
alter the balance of consumption and
investment within the domestic economies of exporting countries.
[45]
Systemic inflation does occur indirectly in the debtor country from the
increase in deposits there. This is discussed below.
Click here to see : FIGURE 1 : THE CURRENT
ACCOUNT PROCESS. (Start tracking from the red square in the
lower right hand corner of Figure 1.)
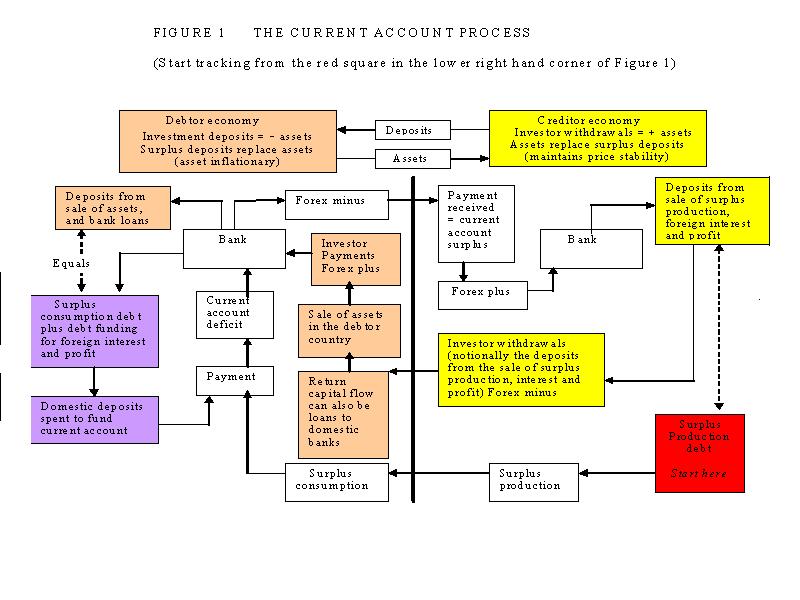
Creditor country “investor
withdrawals” shown on the lower right hand side of Figure 1 are surplus
domestic deposits in the creditor country arising from the production debt used
to produce the current account surplus. To avoid inflation in the creditor
country those deposits are switched from domestic consumption there to foreign
“investment”, through bank intermediation.
Much, if not most, foreign
“investment” fails to qualify as productive investment as defined under the
SNA. The creditor country produces those surplus goods and services. Both the
production debt used to produce them and the corresponding incomes in the form
of compensation of employees and gross operating surplus foreseen in the SNA
exist in the domestic economy of the creditor country. The surplus goods and
services are therefore part of the gross domestic product of the creditor
country. GDP has been defined as:
“The total market value of goods and services produced in [a country]
after deducting the cost of goods and services utilised in the process of
production, but before deducting allowances for the consumption of fixed
capital.” [46]
[46]
As shown below, a negative
“balance on external goods and services” is funded by new domestic consumer
debt in the importing debtor country. A positive balance on external goods and
services is, in principle, exchanged for capital goods imported from debtor
countries through the current account.
At the point of production,
all incomes, whoever owns them, are deemed to be in domestic accounts. The
creditor country swaps its spare production for (mostly existing) foreign
capital goods produced elsewhere while the debtor country creates the same
amount of new debt to buy the spare production imported from the creditor
country.
That
new debt forms part of the debtor country’s current account because there are
no “spare” deposits created in the debtor country during the production phase
of the imported goods.
Interest and profit remitted
abroad as a result of foreign ownership of domestic production form part of
domestic incomes in the debtor economy. When the remittances covering interest
and profit are sent offshore they form part of the current account expenditure.
Domestic deposits in the remitting country are reduced by the same
amount.
In a debt-based economy, it is
not possible to both consume domestic production and pay for the remittances to
foreign countries covering interest and profit because that would mean spending
the same deposit twice. The cost of remittances for interest and profit payable
abroad must therefore also be borrowed within the domestic economy of the
debtor country to enable the value of goods and services in the debtor country,
represented by the remittances, to be consumed. That adds to consumer debt
in the debtor country.
The
total new deposits in the debtor country, in principle, therefore, include all
of its accumulated current account deficits.
The debtor country sells some
of its capital goods to get back the corresponding deposits from abroad that it
used to pay for the surplus imports, the remittances and the remainder of its
current account deficit. That sale balances its foreign exchange position and
leaves it with additional domestic deposits equal to the added consumer debt.
Those deposits from the sale of capital goods do not return to those who
borrowed the debt to pay for the surplus goods and services and remittances
sent offshore. They finish up, instead, in the hands of those in the
debtor country who have sold assets (or an indirect claim on those assets) to
the creditor country to settle the current account deficit. This means the
debtor country’s capital account must be reduced accordingly.
In Figure 1, the debtor
country finishes up with the new debt that created the deposits used to buy the
surplus foreign production it imports and to fund its other remittances
offshore, enabling it to balance its foreign exchange position. The creditor
country receives those deposits. They are then returned to the debtor country
when the debtor country sells domestic assets (or bonds or commercial paper) to
its foreign creditors. The repatriation of deposits from the creditor country
is shown as “investor withdrawals” at the lower right hand side of Figure
1. For the foreign exchange position of the debtor and creditor countries
to balance, the sale of debtor country assets (or bonds or commercial paper) MUST take place. The market price
paid by the creditor country for the assets in terms of its own currency is
determined by the currency exchange rate between the two countries.
The debtor country deposits
arising from those asset sales are not inflationary as long as they are used
for new productive investment within the strict terms of the SNA. If any of
them were to be used for consumption there would be some consumer price (CPI)
inflation in the debtor country. Deposits used to buy existing assets in the
debtor country would cause inflation (such as in property prices) in the
unproductive investment sector. Many of the deposits arising from the sale of
capital goods by a debtor country to balance its current account are used that
way, contributing to the asset inflation commonly observed there. In any case,
according to the debt model, the extra deposits in the debtor country cause
additional systemic inflation through the on-going payment of deposit interest
on the extra deposits. In that indirect sense, current account deficits are always inflationary in the debtor country.
The amount of inflation depends on the interest rate paid on deposits in the
debtor country and the tax rate on interest income there.
This discussion suggests the current accounts of the world’s
nations should always be balanced and there should be mechanisms in place to
ensure a balance is maintained.
John Maynard Keynes argued for
balanced trade at the Bretton Woods conference in 1944, but lost out under
In
The use of the term “saving”
to describe a current account surplus is therefore misleading [48]. In Figure 1
the creditor country has surplus deposits. It uses the deposits to buy foreign
assets not because it has saved but because it has sold surplus production
offshore. It is a trading dynamic, not a conscious decision to forgo or defer
consumption. It is often more a function of overproduction than
under-consumption. The assets it buys mostly represent existing wealth
like equities, businesses, property, and related loans, rather than new
investment in bonds and business expansion in the debtor country that would be
defined as productive investment in the SNA. It is not “saving” as defined
in orthodox economic theory because the purchased assets do not relate to new
domestic production in the creditor country and do not alter its gross domestic
product.
From the debtor country’s
point of view, deposits arising from foreign capital inflows on the current
account “invested” in funds that are not committed to productive investment or
that are held in the form of loans to domestic banks do not qualify as
investments in the debtor country national accounts. They do so only when they
are committed to new productive capacity in the debtor country. Instead, most
inflows that appear as domestic deposits in the debtor country typically
qualify as “investment” in the unproductive investment sector that serves to
inflate the value of existing assets or “wealth” there. Such “investment”
neither adds to nor reduces production capacity. It does not qualify as
investment under the SNA and is therefore not “saving” as defined in orthodox
economic theory. Moreover, any deposits from the capital inflows used to retire
existing debt in the debtor country reduce debt and deposits by the same
amount. They do not affect the domestic economy of the debtor country other
than to reduce its rate of systemic inflation a little [49].
Treating a current account
surplus or deficit as wholly positive or negative in the saving equation (13)
in the National income and outlay account therefore cannot be correct because
the “investment” arises from consumer debt as shown in Figure 1 [50].
The SNA National income and
outlay account [51] does contain the gross operating
surplus and “consumption of fixed capital”, so it does make allowance within the account for investment
qualifying as productive investment under the SNA. However this investment is not the residual referred to as “Saving” in the national income and outlay account.
In the debt model, new capital goods are produced and then “consumed” in the sense
of being purchased as is discussed fully in Section 5 of this paper. All new
capital goods are bought from total incomes given on the income side of the
national income and outlay account. Repayment of existing debt comes out of the
income (the gross operating surplus in the national accounts) generated from
existing and new capital investment. The more repayments there are, the
less net income there will be left over to pay for new capital goods. Net
expenditure on new productive investment in the national accounts should, from
equation (1), therefore be:
Saving S = Productive investment = DI-C = gross
fixed capital formation less principal
repayments. (14)
[47] Reserve Bank of New Zealand Table C3 (current).
[48] The SNA amplifies this at United Nations, 2008, Ch. 26 “The rest of the
world accounts and links to the balance of payments, BOPM6”.
It says at p. 683, “In the SNA,
transactions between a resident unit and the current external balance thus show
how far residents call on saving by non-residents.”
[49] This is true even if the debt retired forms part of the productive
transaction deposits My in the debt model. In that case, other players in the productive economy
would have “spare” income leading either to inflation or to additional non-SNA
qualifying “savings” as discussed in Section 5.
[50] It could perhaps be labelled “surplus consumption debt plus debt
funding for foreign interest and profit”.
[51] Shown as Table
Equation (14) reflects the
fundamental orthodox economic premise stated at page 11 of this paper that
Saving = (productive) Investment. Productive Saving is a net figure that
recognises that some of the incomes nominally available for investment are used
to retire existing investment debt. Only the net income left over after
debt retirement is still available to buy new capital assets as discussed fully
in section 5 of this paper.
The
SNA national accounts are not presented in the format shown in equation (14).
In fact, there is no such
thing as the “residual” “saving” figure that is presently shown in the national
income and outlay account of the national accounts. Saving S = (Productive) Investment is
indirectly built into the income side of the national income and outlay account
(as presently presented in the national accounts) as “gross fixed capital
formation” (Investment) less “consumption of fixed capital” (depreciation) but,
as discussed in section 5 below, that is neither accurate nor sufficient.
In a creditor country the
production surplus is sold through its current account but it does not qualify
as investment in Equation (14). The purchase of foreign assets by a creditor
country is an exchange of spare domestic consumption capacity in the creditor
country for other (capital) goods from the debtor country. That is
fundamentally no different than if the spare production were consumed
domestically. The total income and
expenditure remain the same. The only difference is that the capital
account balances of the creditor and debtor countries change.
The purchase of offshore
assets including loans to offshore banks is, from the point of view of the
creditor country, income earning and “productive” at the price paid for them,
otherwise the exchange would not take place. That “income” is not strictly
national income for the creditor country because it cannot be remitted
there. It forms part of the creditor country’s current account surplus
that is, in turn, swapped for more foreign assets, and so on as long as the
current account surplus continues.
The key conceptual element
is the “swap” that takes place within the domestic economies of the debtor and
creditor countries.
In a debt based financial
system, deposits to pay for surplus consumption and remittances in the debtor
country originate outside of that country’s production cycle. The only “income”
generated is that resulting from the subsequent sale of capital goods in the
debtor economy to its foreign creditors, but that must be treated as a economic
loss rather than income from production.
Taking the current account
balance in creditor countries and debtor countries in turn the sequence of the
exchange that takes place is :
Any gross fixed capital
formation from return capital flows invested by a creditor country as foreign
direct investment in new capital goods in the debtor country is automatically
included in the GDP of the debtor country [52]. The increase in the total
capital value in the creditor country contributed by the capital goods it
receives in payment of the debtor country’s CA deficit should be recorded in
its capital account as well, if it is to be treated as income, as in its
National income and outlay account.
In a debtor country, gross fixed capital
formation arising from any return capital flows invested by the creditor
country in new capital goods in the debtor country is automatically included in
the GDP of the debtor country [53]. The decrease in the total capital
value of capital goods in the debtor country resulting from its sale of capital
goods to the creditor country in payment of the debtor country’s CA deficit
should be recorded in its capital account as well as, if it is to be treated as
negative income, in its National income and outlay account.
These sequences comply with
the traditional orthodox economic theory represented by the amended savings
equation (15) below. When a country’s current account is in balance or when the
current account balance is omitted from the national income and outlay account
as proposed above, equation (14) becomes:
Saving S (net)(Investment)
= Current account surplus (CA)
+ Gross capital formation (including increase in stocks) [54]
- Consumption of fixed capital (depreciation)
+ Statistical discrepancy
[55]
(15)
[52] It is assumed that, since the debt that gives rise to the sale of
capital goods in the debtor country already exists, the deposits created from
that debt also exist at any point in time. Any productive investment arising
from those deposits returned to the debtor country in payment for its capital
assets is therefore automatically included in the debtor country’s
domestic gross fixed capital formation.
[53] It is assumed that, since the debt that gives rise to the sale of
capital goods in the debtor country already exists, the deposits created from
that debt also exist at any point in time. Any productive investment arising
from those deposits returned to the debtor country in payment for its capital
assets is therefore automatically included in the debtor country’s domestic
gross fixed capital formation.
[54] Gross capital formation is another term for (gross productive)
Investment. Increase in stocks is also usually treated as investment by
convention.
[55] Required because of errors in the GDP production and expenditure
estimates even though the operating surplus is itself already a residual.
In equation (15) investment is
still incorrectly defined
as Gross capital formation (including increase in stocks) less Consumption of
fixed capital (depreciation).
Equation (15) would only
represent Savings = Investment according to the orthodox economic theory if
consumption of fixed capital (depreciation) were a cash flow and the increase
in stocks represented productive investment. It is not and they do not.
Equation (15) as it stands
still does not represent orthodox economic theory.
The mechanical processes relating to capital flows,
the purchase of capital goods, and changes in inventories (stocks) are
discussed further in Sections 5 and 6 of this paper.
The amended National Disposable Income (DI) for New
Zealand 1962-2010 is shown in Figure 7 of this paper. Figure 7 incorporates the
following changes to the existing SNA format :
(a) deletion (or reduction) of the change in
inventory from the gross product and expenditure account and corresponding
correction of the gross operating surplus.
(b) substituting the corrected gross operating
surplus after subtracting the “balance on external goods and
services”.
(c) replacing residual ‘saving” with Saving as
in equation (15) but with
principal repayments substituted for depreciation.
(d) deleting the current account surplus,
including the “balance on external goods and services”.
Contrary to the methods of calculation in use until
now, the proposed changes provide rational results for
05. CAPITAL FLOWS AND THE PURCHASE OF CAPITAL
GOODS.
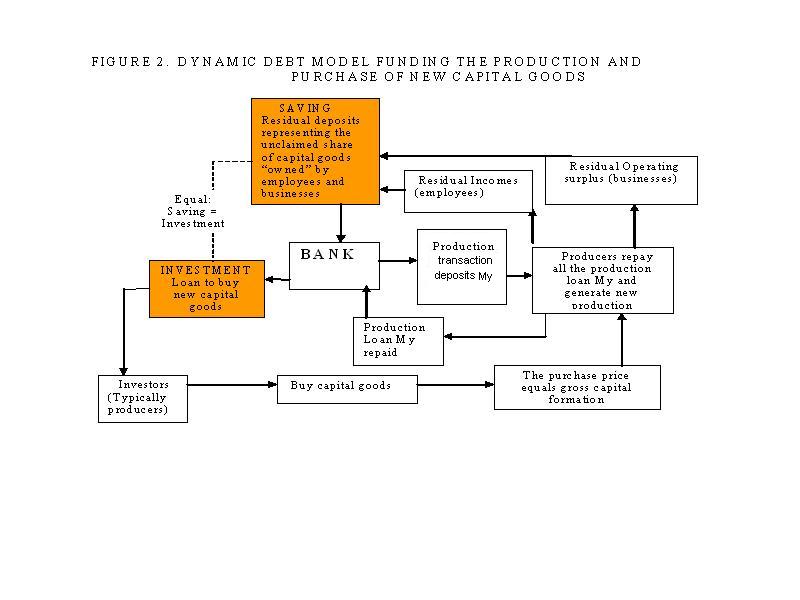
The production of goods and
services giving rise to new capital goods is included in the productive
transaction deposits as My that when multiplied by their
speed of circulation Vy give rise to the Gross Domestic Product (GDP).
[56] Those new capital goods must be sold to clear the market. Since the
income earners in the productive sector who want to buy the capital goods are
not usually the same as those who produce the capital goods, they are exchanged
through bank intermediation. The buyers of the capital goods borrow part of the
production incomes of employees (employee incomes) and businesses (gross
operating surplus) as shown in the upper part of Figure 2. That enables the
original producer loans to be retired, thereby clearing the market as the debt
model requires.
[56] See The interest-bearing debt system and
its economic impacts for details of the debt
model.
In aggregate, some employees and
businesses have swapped their share of the sale price of the capital goods that
they do not want to consume with others in the productive sector (the
investors shown at the lower left of Figure 2), who do want to consume
them. This creates lending within
the productive sector.
Click here to view : FIGURE 2. DYNAMIC DEBT MODEL FUNDING THE PRODUCTION
AND PURCHASE OF NEW CAPITAL GOODS.
In Figure 2 the bank loans
supporting the production transaction deposits conceptually retired in each
production cycle. (See The interest-bearing debt system and
its economic impacts). My is assumed for simplicity to include the whole value
of goods produced during the production cycle.
In
the hypothetical case when no capital goods are produced, the outside loop on
the left and bottom of Figure 2 would not be needed. The transaction deposits My would be used to produce goods and services for consumption, generating
incomes. The incomes would be banked and then used to pay for consumption. The
producers would then use the sale income to pay off their transaction deposits My. In practice the process is dynamic. There is always an outstanding pool
of transaction deposits My that is continually being recycled through
the production system.
When capital goods are also
produced as shown on the left and lower part of Figure 2, producers (employees
and businesses) initially collectively “own” the capital (investment) goods
they produce. Conceptually, they hold their share of the capital goods as
security for the bank loan (part of the debt giving rise to My ) used to produce them. The bank loan (part of the debt giving
rise to My) used to produce the capital goods has to be
repaid when they are sold just as is the case for consumption goods and
services.
The producers have an asset
equal to the sale value of the capital goods and an equal offsetting liability,
their debt (part of the debt giving rise to My) to the bank. The
debt model assumes for simplicity that, during the production phase of the
production cycle, producers draw down (pay themselves) all of their operating
surplus as income [57]. The production transaction deposits My represent the full sale value of all the goods and services, including capital goods,
produced during the production phase.
[57]
For simplicity, in the debt model, all income including all of the gross operating
surplus is included in My. Any error in this
assumption is small because My is small compared to GDP.
Once the consumption goods and
services have been consumed only the capital goods are left. The market sale value of those capital goods
that have not yet been “consumed” equals the remaining incomes that have not
yet been spent, as shown at the top left of Figure 2. The remaining
incomes are the Saving required by orthodox economics as discussed in section 4
of this paper. The capital goods for sale are the corresponding investment.
This gives Saving = (productive)
Investment as in equation (14).
Producers must sell the
capital goods they have produced to repay their bank debt (part of the debt
giving rise to My). When they do so, the buyers of the capital
goods take out a bank loan as shown on the left of Figure 2. The total of such
loans is the Saving shown at the top of Figure 2. The buyer of the capital good
(the investor) pays the producer the sale price and the producer then retires the
outstanding loan (part of the debt giving rise to My) used to produce
the capital good. Conceptually the investors (bottom left of Figure 2) have
borrowed just enough from the Saving pool (top of Figure 2) to clear the
outstanding production debt (part of the debt giving rise to My) used to produce the capital goods. That is exactly as defined in the
Baumol and Blinder quote on page 11 of this paper. The only way for the market
to clear without inflation or deflation is where the purchase price of the capital goods to be “saved” by one part of
the productive sector equals the sum on-loaned to investors who usually form
another part of the productive sector, exactly as orthodox theory
requires.
Capital
formation therefore conceptually takes place by new debt formation within the
productive sector itself. It is the
re-allocation of existing incomes in the productive sector.
This
is in full agreement with orthodox economic theory.
In aggregate, “Saving” in the
orthodox sense of Saving = (Productive) Investment as illustrated in Figure 2
occurs only to the extent some employees and businesses lend some of their
market incomes to other players in the same market who wish to buy the capital
goods that are available. If some of those market incomes (employee incomes and
gross operating surplus as shown at the top right of Figure 2) are withdrawn
from circulation in the form of non-productive “saving” for non-productive
“investment” as currently claimed in the SNA National Income and Outlay
accounts, or for debt retirement, either an equivalent amount of NEW bank debt MUST be introduced to make up the difference or economic activity
will be suppressed. There would not be enough income left to buy all the goods
and services, including capital goods, which have been produced. [See
Figure 3 investment I1 below and section 4 of this paper]. The only
exception to this would be where an equal existing non-productive “investment”
deposits were returned to the productive economy to be used for consumption. This
happens, for example, when pensions are paid out of pension funds.
In
practice, as shown in the more recent paper The DNA of the debt-based economy all of the net capital investment is initially represented by bank debt and the
accumulated outstanding principal on that debt equals the GDP. That is because
the residual existing incomes in the productive sector referred to above are
withdrawn from circulation to satisfy the requirements of the debt model (Ms + Dca + Db). They are a structural part of
the debt system and are not related to voluntary “saving”. That is why trying
to increase non-productive “saving” destroys economic activity unless that
”saving” is invested in new productive
capacity.
Figure 3 traces the broad
savings impact in a debt-based economy. It assumes the residual “saving”
presently shown in the income and outlay account of the national accounts
prepared under the SNA (called here Type 1 saving) is a myth.
Let Type 2 saving (the funding
available from income and operating surplus shown at the top of Figure 3) be
T2.
Let Type 3 “saving” (the
funding available from the current account surplus as presently shown in the
income and outlay account of the national accounts prepared under the SNA) be
T3. It is shown at the centre of Figure 3.
Let new debt funding from
domestic banks be Bd. This is shown at the bottom of Figure 3.
Further let the funding T2, T3
and Bd be distributed according to the following six uses:
I1 = productive
investment
I2 = change in
inventories
I3 = loans and bonds to
business
I4 = loans and bonds to
government
I5 = purchase of
existing assets
I6 = loans and bonds to
commercial banks
Let a, b, c, d, e, f be
the proportion of Type 2 funding applied to each use, g, h, i, j, k, l be the
proportion of Type 3 funding applied to each use and let m, n, o, p, q be the
proportion of new bank debt applied to each use.
The resulting schema shown in
Figure 3 applies to creditor countries and shows the sources and distribution
of funding. Its application to debtor countries is discussed above. Links
considered to be minor are shown dotted. Consumption is omitted.
Click here to view FIGURE 3. SCHEMATIC CAPITAL FLOWS: SOURCES AND USES
OF “SAVING” AND “INVESTMENT.”[58]: CREDITOR COUNTRIES.
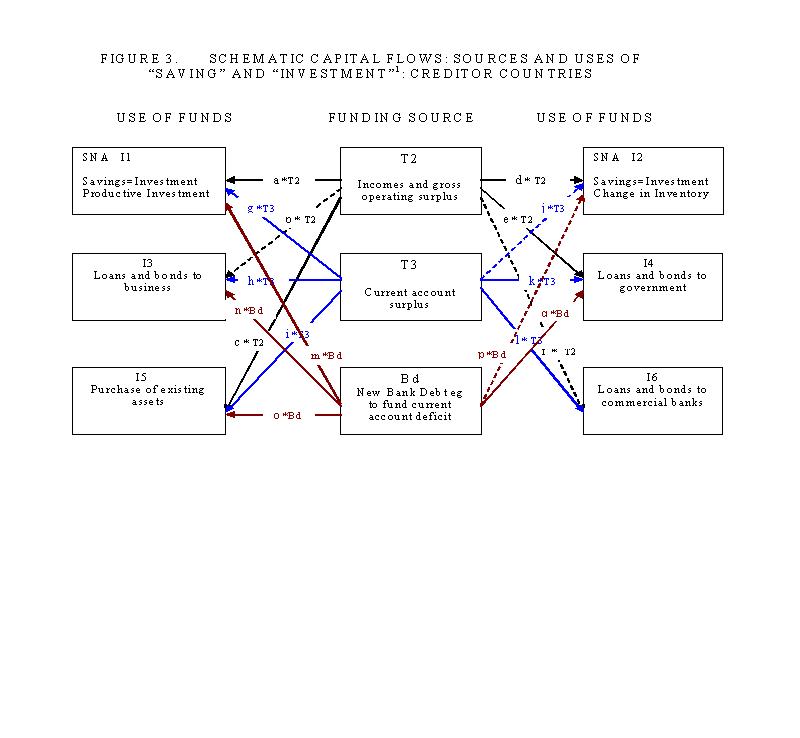
[58]
Figure 3 is drawn from the point of view of a creditor country.
There are many known quantities
in the matrix shown in Figure 3 and it should be possible to calculate each of
the proportions a, ………q. At this point the intent of Figure 3 is to show
how the current system of national accounts (SNA) and orthodox economics fail
to reflect the real dynamic economy. A more detailed analysis would
require a separate paper.
There are several obvious
relationships. For example:
a*T2 + g*T3+ m*Bd
= Productive investment I1, whether Gross fixed capital formation or net
fixed capital formation. (Net fixed capital formation = Gross fixed capital
formation – Principal repayments on existing capital goods).
For the market to clear just
current production of all goods and services, (g*T3 + m*Bd) must represent net
household, business and government non-productive “savings” including, in New
Zealand, Kiwisaver, the various superannuation funds like the Cullen
Superannuation Fund, and sinking funds like Accident Compensation Corporation
and the Government Earthquake Fund. Otherwise, as described above,
productive Saving could not equal Investment as shown in Figure 2.
That in turn suggests:
g*T3+m*Bd
= b*T2+c*T2+d*T2+e*T2+f*T2.
If that were not so, the
productive sector would either inflate or deflate because demand does not match
the goods and services available for consumption. The total of
b*T2+c*T2+d*T2+e*T2+f*T2 represents a withdrawal of purchasing power from
incomes leaving too little income to buy the available goods and services that
have been produced. The withdrawal must be replaced with new purchasing power
if the market is to clear. The only replacement funding to T2 (neglecting j* T3
and p* Bd) is g*T3 and m* Bd. That is what gives rise to the equality proposed
above.
The ratio f, the proportion of
T2 “savings” from incomes and operating surpluses “invested” in the form of
loans and bonds to commercial banks, is usually small. Net household, business
and government “savings” from incomes and operating surpluses pass largely into
non-productive investments. In the case of c*T2 they inflate the value of
existing assets and in the case of e*T2 they support government budget
deficits.
Figure 3 is drawn from the
point of view of a creditor country with a current account surplus. It shows
how the outward capital flow through the current account surplus T3 is spent,
that is, what the creditor country buys with the surplus. For some countries,
l*T3 (funds from the T3 current account surplus loaned to commercial banks in
the form of financial instruments such as bonds) has become an important part
of the T3 capital flow to debtor countries. It is part of the so-called “carry”
trade. It can be cheaper for banks to borrow foreign money and hold foreign
exchange liabilities than it is for them to pay deposit interest on domestic
deposits arising from the sale of domestic assets to offset foreign exchange
obligations, especially if the liabilities are hedged in the local currency.
The widely held belief that
bank funds borrowed offshore give rise to escalating property prices is false. This
is because the domestic debt that causes the borrowing has already been created
to fund the current account deficit. On the other hand, as described in Section
4 of this paper, the sale of domestic assets to settle the debtor country’s
foreign exchange obligations does result in debtor country deposits that do tend to inflate existing asset “values” there as well as
increase the debt model systemic inflation.
The
creation of domestic debt in the debtor country precedes the return capital
flow from the creditor country. The sale by NZ registered banks of bonds to
foreigners is just another form of foreign investment by the creditor country.
The root cause of asset price inflation rests in the mechanics of the debt
system itself, as set out in the debt model for which links are provided at the
start of Section
The situation in debtor
countries is slightly more complicated than shown in Figure 3. Figure 3
shows what creditor countries buy with their inward capital flow. The capital
comes in, and domestic assets of the debtor country are sold, though often
indirectly as in the case of investment categories I3, I4 and I6, including
bank commercial paper.
Domestic assets in debtor
countries, on the other hand, do not just pass into foreign ownership. There is
a further issue over what the domestic seller in the debtor country does with
the deposit resulting from the sale of domestic assets. For example, if the
loans and bonds to business (I3) are used to finance mergers there is no new
productive investment from the process. If deposits from the purchase of
existing assets (I5) by foreigners are used for consumption or for bidding up
the price of other existing assets (for example if the previous owner retires)
they will lead to asset price inflation. The opposite would be the case if they
were used to retire existing domestic debt. While Figure 3 assumes for
simplicity that none of the T3 capital flows is used for consumption it is
theoretically possible some consumption does occur.
Fundamentally,
there is no such thing as foreign debt. There is only foreign ownership
of a debtor country’s productive resources and other assets. Current account
surpluses must be generated if the foreign ownership is to be reduced.
The new productive investments
shown in Figure 2 produce income. They form part of the (presumably) growing
productive sector. The debt used to purchase them is progressively repaid from
the income received.
Any part of aggregate domestic
production incomes held by foreigners that is repatriated abroad is part of the
current account of both the debtor and creditor countries. In
Current
account transactions are EXCHANGE transactions, not production transactions. In the debtor
country GDP incomes exclude extra payments needed to pay for surplus imports.
The “balance on external goods and services” is part of the additional debt it
must borrow to settle its current account. The additional debt figure is negative
when the balance on external goods and services is positive and positive when
the balance is negative. A positive trade balance simply reduces the current
account deficit of a debtor country. A similar thing happens in the creditor
country. There the incomes that still exist when the surplus goods are exported
are offset (sterilised) by the subsequent purchase of offshore assets.
There is no “saving” residual on the “use of
income” side of the National income and outlay account because the items
Current account balance (CA) and the “Purchase abroad of non-productive capital
investment goods” there cancel each other out. There is, instead, (subject
always to the following sections 6 and 7 of this paper and Figure 4 below) a
known quantum of saving as in equation (15).
Saving S
(net) = + Gross capital formation (including
increase in stocks) [59].
- Consumption of fixed capital (depreciation).
+ Statistical discrepancy [60].
(15)
[59]
Gross capital formation is the same as Investment. The increase in stocks is
also usually treated as investment by convention.
[60] Required
because of errors in the GDP production and expenditure estimates even though
the operating surplus is itself already a residual.
That brings the national
income and outlay account into agreement with conventional economic theory as
discussed in Section 4 as long as
depreciation is replaced with “principal repayments” and as long as the gross
operating surplus is what is left after the balance on the external account has
been subtracted.
Leaving aside the Current
Account balance as in Section 4 of this paper and substituting directly from
SNA Table 1.1 of the National Accounts, the “income” side of the National
income an outlay account then becomes:
National disposable income
(DI) = Compensation of employees
+ Gross operating surplus
+ Taxes on production and imports
(less subsidies)
Change in inventories
Gross fixed capital
formation
+ Gross fixed capital
formation (including increase in stocks)
- Consumption of fixed
capital
(16)
Even more simply, substituting
the terms for GDP from equation
National disposable
income (DI) = Gross Domestic Product
- Balance on external goods and services
- Consumption of fixed
capital (17)
Equation 17
is logical as long as “consumption of fixed capital” is replaced with
“principal repayments”, as discussed in Section 7 of this paper. The total
amount available to spend is what is earned less debt cancellation through debt
retirement and what by necessity has been spent or sent abroad. A positive
balance on external goods and services is not “disposable” because it is
unavailable to the domestic economy. On the other hand, a negative balance is
“disposable” because it is available to the domestic economy even though the
“income” to buy it is borrowed rather than earned. That means National
disposable income is quite a different concept from GDP, and, on the face of
it, is misnamed. The “statistical discrepancy” in equation (15) might not be
required because there would be only one residual number in Tables 1.1 and 1.2
of the National Accounts, namely the “gross operating surplus” whereas there
were previously two: the “gross operating surplus” and “saving”.
And, where the current account
surplus is treated as income in the National accounts, it must included in both
sides of DI:
Use of income side: =
Final consumption C
+ Purchase abroad of non-productive
capital investment goods (=CA)
+ Saving for productive investment
S
(18)
Income side: =
GDP
+ Current account balance (CA)
less the balance on external goods
and services
less repayments of principal on
outstanding productive investment
(19)
Figure 4 shows a first
approximation of principal repayments as a proportion of gross fixed capital
formation in
Saving in developed
countries, particularly debtor countries like
National
saving has been swapped this way for short-term profit, typically boosting
stock and existing property prices instead of longer-term investment.
Until now, there has been
little or no mention in economics literature of this structural impact on
saving. The use of depreciation in the National accounts under the SNA is
incorrect because it represents neither the true cash flow nor does it conform
to appropriate accounting practice for the nations of the world.
Repayments of household debt,
as distinct from business debt, tend to be directly related to household debt
levels because depreciation of residential household property in countries like
[61] For example, if the depreciation rate on a purchase of $10.000 is
increased from 20% to 25% (therefore repaid in about 3 years) the extra
depreciation is $500/year, whereas the interest saved (at 10%) is just 10% of,
say, a $650 extra annual repayment, or $65 per year for 3 years; about $200
altogether. The firm’s profit increases by roughly $300/year.
[62] United Nations, 2008 par. A.3.88 p.589 states: “The 2008 SNA
recommends that the consumption of fixed capital should be measured at the
average prices of the period with respect to a constant-quality price
index of the asset concerned”. This appears to exaggerate the “depreciation”
effect on saving.
[63] Manning Lowell The interest-bearing debt system and
its economic impacts Version 5 14/8/11
Sections 3 and 4.
[64]
Refer to the link How to create stable financial
systems in four complementary steps.
The potential for households
to repay capital is strongly influenced by interest rates.
Mortgage terms typically
tend to be in the 25 to 30 year range to guarantee repayment, because the
nominal lifetime of domestic dwellings rarely exceeds 50 years. The standard
New Zealand Inland Revenue Department “diminishing value” depreciation rate on
most buildings is 3%. Since most buildings are on-sold in about 7 years on
average, most people will prefer to use the diminishing value rate of 3% rather
than the “lineal” depreciation rate of 2%. Each time the property is sold the
purchase price becomes the new baseline for depreciation. The result is that
most property is depreciated as if it had a lifetime of 33 years
rather than 50 years. The figure 33/25 (25 year loan) indicates a repayment
rate of 32% above the depreciation figure while 33/30 (30 year loan) indicates
a repayment rate of 10% above the depreciation figure. The average would be
around 21% if home loans were equally distributed between 25 and 30 years. They
are not, and some loans are for a shorter period, but the figures broadly
support the preliminary empirical “average” figure of 23% used in this paper.
Most property transactions
involve existing (second-hand) properties. Rising interest rates reduce
household debt servicing capacity while lower interest rates increase it.
Higher interest rates increase the drain of unearned income from household
incomes. In the longer term, household saving is practicable only in a
financial system based on interest-free money. Interest free money prevents
income being stripped from households through the payment of unearned deposit
income as interest on exponentially increasing debt.
Click here to see : FIGURE 4. PRINCIPAL
REPAYMENTS AS A PROPORTION OF GROSS FIXED CAPITAL FORMATION IN NEW ZEALAND
1962-2010. [65]
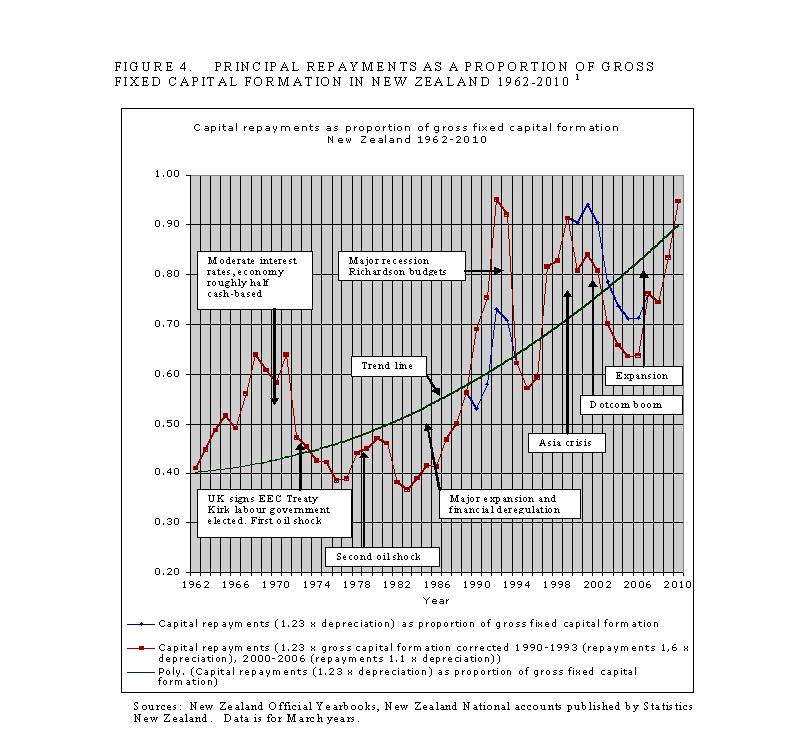
[65] Figure 4 is provisional
because it is based on an estimated repayment rate 23% higher than the
consumption of fixed capital. The figure of 23% is believed to be accurate on
average over the period, but varies from year to year according to the business
cycle. In
Interest-free money would avoid
systemic inflation in the productive economy and enable real income growth from
higher productivity to be better reflected in household incomes.
The proportion of
capital repayments to gross capital formation tends to rise when times are bad
because new capital formation declines. Loan defaults lead to faster debt
retirement as firms and households struggle to meet mortgage repayments when
interest rates are high and banks must write off losses. It is also likely
that population mobility decline because of rising unemployment and fewer job
opportunities. On the
other hand, the proportion of capital repayments reduces during expansions
because debt expansion and capital formation increase as the banks relax their
lending criteria.
The principal
repayments in Figure 4 are based on 123% of the depreciation shown in the
official SNA national accounts. Using
principal repayments equal to 123% the SNA depreciation gives very good results
for
For comparison with
existing New Zealand National account data, Figure 5 shows New Zealand SNA
saving in billions of New Zealand dollars calculated as proposed in equation
(14) and that same saving as a percentage of New Zealand GDP. Saving is plotted
as gross fixed capital formation according to current SNA practice less 1.23
times the SNA consumption of fixed capital and with the data series “corrected”
for 1990-1993 and 2000-2006 as mentioned above. This means that assumed actual
capital repayments have been applied in Figure 5 instead of the depreciation
figures presently used in the SNA.
Figure 5 reveals a
shocking structural decline in Saving in
The decline in national saving is structural and cannot be addressed
anywhere in the world using existing orthodox economic theory and policy.
Capital transfers and
“investment” flows unrelated to the current account are also part of the
existing National capital account of the SNA. They are, in the first instance,
transfers of deposits, not capital goods. Capital flows reduce the
domestic deposits and foreign exchange reserves of the donor country and create
a corresponding increase in the deposits and reserves of the country that
receives them. Whether or not those capital transfers are productive or
inflationary in the recipient country depends upon how they are used there. In
either case, the foreign exchange mechanism still has to be satisfied just as
for the current account. In aggregate, the donor country must sell capital assets
or surplus production to the recipient country to balance its foreign exchange
account. The recipient country must
“spend” the transfer money to reverse the inward capital transfer and balance
its foreign exchange account [66].
[66] For much of the period in New Zealand 1962-2010, capital transfers were
considered to be part of the current account because they could not be distinguished
from current transfers. United Nations, 2008, at par. 8.38-8.40, p.162
attempts to define the distinction.
Click here to see : FIGURE 5. NATIONAL SAVING S, AND NATIONAL SAVINGS S AS A PERCENTAGE
OF GDP NEW ZEALAND 1962-1010.
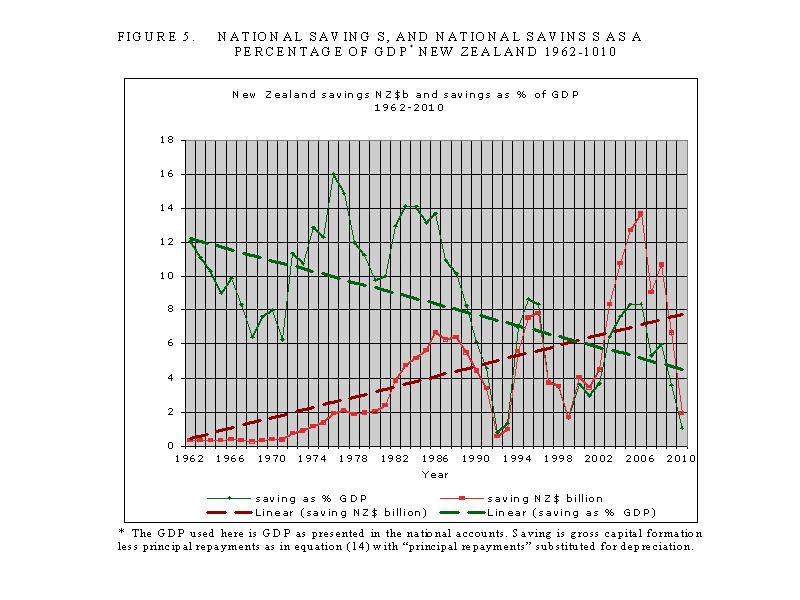
Capital
transfers result in the outflow of capital goods from the donor country
and inflow of capital goods to the receiving country and this exchange
should be recorded in the National capital account. . Whether the deposit
from the initial capital transfer is productive, non-productive or inflationary
depends upon how it is used in the receiving country.
6. CHANGES
IN INVENTORIES (STOCKS).
This paper proposes that
increases in stocks are not investments as stated by convention in the SNA.
Stocks may even have zero economic value. Increases in stocks are treated as
investment in the SNA at present because they are viewed as goods and services
left over (“saved”) for later sale. They have been produced but not consumed
and their cost of production is already included in the SNA on the income side
of the national accounts.
If the residual incomes
from the production of the spare inventory were still in circulation, leftover
goods and services would
be consumed. Since residual incomes are not available for the purchase of the
spare inventory they must already have been “spent” on other consumption or on
debt reduction or on non-SNA compliant “saving”, which is discussed in detail
in section 7. Increases in inventory, other than what is needed to offset
population growth and inflation, represent a market mismatch. In practical
terms, final prices have been too high to clear the market. There are three
possible causes for this. The first possible cause is that business has failed
to discount prices enough in the (forlorn) hope that future incomes will grow
faster than production. In that case current prices could be maintained. The
second possible cause is where the incomes to pay for the spare inventory have
been drawn out of circulation through non-SNA compliant “savings” programs. The
third possible cause is debt reduction, especially consumer debt, particularly
expensive credit card debt.
“Savings” in funds that
fail to qualify as investment in the national accounts and in orthodox economic
theory, such as, in New Zealand, the government National Provident Fund, the
government “Cullen” Superannuation fund, the Kiwisaver scheme, and private
superannuation schemes, have to come from somewhere. They are not investments
according to equation (14). Some of the non-SNA compliant “savings” could come
from the “surplus deposits” shown at the top left of Figure 1 that arise from
the current account process discussed in Section 4. Most of them, however,
arise as withdrawals from earned income in the productive sector. This is
because the “savings” programmes are deliberately structured to work that way
in the mistaken belief they will somehow increase economic performance. They
don’t.
Withdrawals of income
from the productive sector lead quickly to economic recession as discussed at
length in The interest-bearing debt system and its economic impacts. They
mean there is less money available from incomes for consumption, leading to
supply exceeding demand, price discounting as businesses seek to avoid
increases in their inventories and job losses as businesses retrench. Powerful
advertising campaigns seek to induce consumers to take on new consumer debt to
maintain or increase consumption. Once discounting reaches the point at which
their profit is exhausted, firms begin to fail. Despite those consequences,
inventories have been growing in
Inventory (other than
“stable” inventory needed to maintain reasonable continuity of supply to
consumers) has little residual value other than increases needed to offset
population growth and inflation. Excess inventory must either be discounted at
a cost to future sales or future production reduced as set out in The interest-bearing debt system and its economic impacts
unless consumers can be persuaded to take on additional consumer debt [68].
Because excess inventory has little or no economic value it should be deleted
from or discounted in the national accounts despite its having been produced.
[69] Otherwise it does not satisfy the “mark to market” rules set out in
the SNA protocol. Much of the
change in inventories is presently “double counted” in the GDP. This
is because the corresponding incomes to buy the change in inventories have
either been siphoned off into non-productive “saving” or used to subsidise the
prices of the goods and services that have already been consumed.
[67]
[68] If
they were there would be no increase in inventory in the first place.
[69]
Though it should probably be noted as a memo item.
7. “SAVINGS” THAT DO NOT QUALIFY AS SAVING UNDER THE SYSTEM OF NATIONAL ACCOUNTS OR ORTHODOX
ECONOMICS.
People do not borrow to
“save”. Yet one of the less fortunate features of developed economies is that
people are encouraged to consume more than they earn. Consumers have even been
encouraged to increase their consumption by refinancing existing property
assets, such as recently happened widely in the
Just as productive
investment has been shown to be a transfer of purchasing power within the
productive sector, the “savings” arising from new debt are typically
transfers of purchasing power among consumers. In a debt-based
financial system, for every participant who “saves” productive income, another
somewhere else must be going into debt to support that saving unless
non-productive investment sector deposits are transferred to the productive
sector to pay for consumption there.
The process is
typically voluntary: some people choose to consume more than they earn by
using consumer finance or by refinancing their assets, while others choose to
consume less than they earn. The market will not clear if the two sides do not
balance and, for example, there is more “saving” than consumer debt generated.
This would lead to increases in inventories, suppression of prices and the
market failure typical of recessions. This will and must happen whenever increases in domestic interest
rates decrease the willingness of consumers to take on more debt.
When “saving” is made
compulsory, the productive economy will contract in comparison with voluntary
saving, prolonging or even causing recession [71]. That will
happen because compulsory saving will usually withdraw more deposits from the
productive economy than voluntary “saving” does. The “investments’ made using
the “saving” typically form part of the non-productive investment sector as is
shown in the paper The interest-bearing debt system and its economic impacts. The
debt supporting them approximately equals (M3-repos) – (M1-M10).
While “savings” form part
of the non-productive investment sector, any income arising from them is
included in productive sector activity as long as it is distributed and used
for productive investment or consumption. If, on the other hand, the income
from the “savings” investment is capitalised, as is commonly the case, the
“savings” increase accordingly, adding further to the total debt the productive
sector must support.
[70] Some of those “savings” may come from reinvestment of deposits arising
from the sale of assets to settle current account balances as discussed in
sections 4 and 5.
[71] Some countries like
Net deposit interest
becomes part of Ms in the debt model while net interest from bonds and commercial paper is
included in productive economy prices for modelling purposes as long as it
forms part of the deposits of the
At the most fundamental
level, increases in the “value” of “savings” investments through revaluations
and capital gains represent increases in measured wealth, not “savings”. They
can be recorded in a “national wealth account” but not in the national
financial accounts.
Figure 6 shows how
Kiwisaver in
Click here to view : FIGURE 6 : GROWTH DESTRUCTION, KIWISAVER NEW ZEALAND. [73] [74]
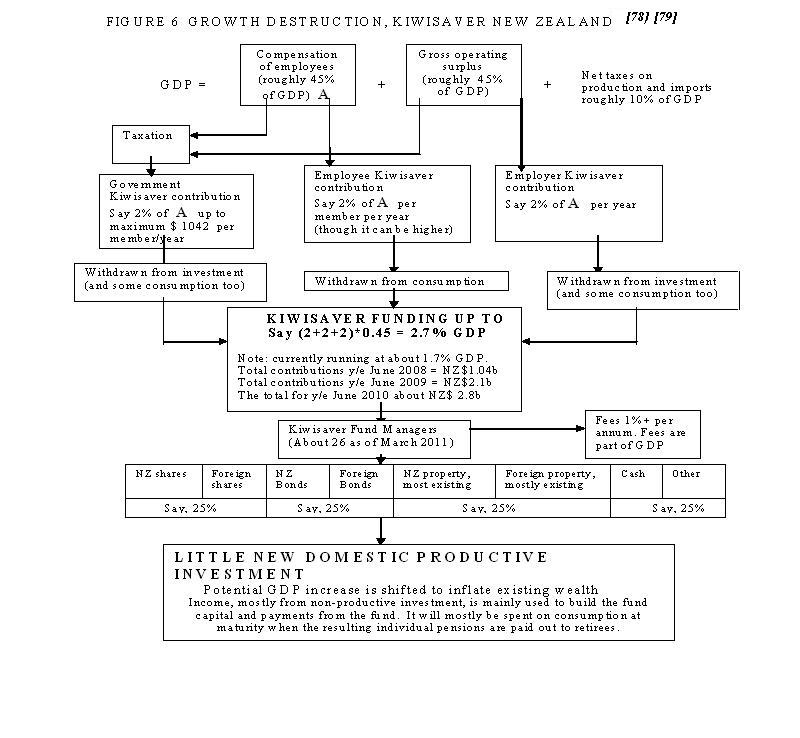
In the existing debt
system the “savings” of the debt model inflate the value of existing assets at
the expense of the productive economy. In
To be economically
effective, existing non-productive “saving” must be redirected into productive domestic business
investment, infrastructure, primary health and education. Otherwise it further increases the mal-distribution of income and wealth
in the community as a whole.
Pension funds like the
New Zealand Superannuation fund and New Zealand Kiwisaver are common around the
world. They are dangerous to the world economy, especially where they are
funded from compulsory contributions out of incomes. The world’s largest 200
pension funds have about US $6 trillion under management while the world’s
aggregate pension fund assets are believed to total about US$ 20 trillion [72].
The largest one is the Japanese Government Investment Pension Fund that has
almost US$ 1.4 trillion dollars. Three of the twelve largest funds are Canadian
(totalling US$ 490 billion) and two of them are Dutch (totalling US$ 436
billion between them, half the Dutch GDP). Collectively the twelve largest funds
manage about US$ 3.5 trillion in “savings” or 17.5% of the world’s total.
Withdrawals from
pension funds are intended to pay all or part of matured retirement pensions on
an on-going basis. Since many pensions are subject to income tax on payment of
the pensions the draw down of pensions provides an important source of tax
revenue for some governments. The “value” of the funds at any time reflects
asset inflation in the unproductive investment sector since just a relatively
small part of the funds is invested in new productive activity. While new
contributions to the funds continually replenish withdrawals, the funds mainly
rely on growth in the speculative “paper economy” to fulfil their future
obligations.
Despite strong
regulatory oversight in many countries, pension funds are subject to a high
degree of moral hazard. Private sector firms manage many of them and make the
investment decisions. Not only do those firms draw fees, some have
misappropriated the funds themselves. This happened recently with some of the
so-called 401k retirement plans [75] in the
In the debt model,
flows into and out of the non-productive investment sector need to be carefully
monitored. As discussed above, contributions into “savings” funds represent
either new consumer debt or reduced purchasing power in the economy or
re-investment of deposits arising from the sale of capital goods to foreigners
as part of the foreign exchange mechanism.
Withdrawals from
"savings" funds must be subtracted from the investment sector
balance(s) whether or not they can be identified as original contributions to
the funds [77]. Withdrawals represent cash flows out of the investment sector
into the productive economy. They will be inflationary for the productive
economy unless they are used for new production, as, for example, when new jobs
are found for the unemployed, they are used to retire existing debt or they are
transferred offshore as current or capital transfers. The withdrawals are
funded mainly from the sale of “investment” assets like shares, property
and bonds. The sale of those assets reduces the total funds in the
non-productive investment sector and would tend to cause investment prices
there to fall.
[72] Sources ex Wikipedia ^Global Investment Review ^ The
Economist Jan 17, 2008 economist.com.
[73] See for example NZ Ministry of Economic
Development http://www.med.govt.nz/templates/MulitpageDocumentPage----45007.aspx
which gives Kiwisaver Market Dynamics, as updated 21/10/2010. About half the
total Kiwisaver funds are “invested” offshore.
[74]
The total investment in the New Zealand Superannuation Fund (Cullen Fund)
31/3/11 = NZ$ 14,4 billion.
[75]
401k refers to the section of the Internal Revenue Code (Title 26 of
the United States Code) that
provides for establishing individual retirement plans. en.wikipedia.org/wiki/401(k).
[76] Chapter 17: Part 2 “Social Insurance Schemes” of SNA 2008, United
Nations 2008, provides a great deal of detail relating to the treatment of savings
and pension schemes, but it does not adequately deal with the issues raised in
this paper.
[77] It appears to be theoretically possible for some debt model investment
balances to be negative. For example, in
8. RE-EVALUATING AND CORRECTING NET SAVINGS AND RELATED ENTRIES IN
THE NATIONAL ACCOUNT.
The change in
inventories with little economic value, as set out in Section 6 of this paper,
can either be omitted altogether from the gross domestic product and
expenditure account or be reduced to a more appropriate level. This is done by
reducing the gross operating surplus on the income side and setting the change
in inventory on the expenditure side to a figure closer to zero. The
effect is to reduce the GDP when the change in inventory is positive and
increase it when the change in inventory is negative. The change in
inventory should perhaps be noted below the national accounts table. The “gross
operating surplus” is part of the GDP. It includes the “balance on
external goods and services” that MUST
be used to buy foreign capital goods and is unavailable to improve the domestic
economy. That reduces the validity
of GDP growth as a measure of domestic economic success.
In
some cases there can be a substantial change in the year on year GDP growth
figures provided in the current SNA-based National Accounts. For example in
[78] There
have also been spectacular over and undercounts in New Zealand in the
past: examples are in the March 1991 year when GDP growth may have been
over-counted by 2.5% and in 2006 when it may have been undercounted by 1.7%. In
general,
Five changes are needed
to the national income and outlay account of the national accounts and seven
changes are proposed to the capital account in the national accounts.
The five changes needed
to the national income and outlay account of the national accounts
are:
(a) On the “use of
income” side, the existing saving residual should be replaced by the true
saving figure (gross capital formation less repayments of principal) as
required by orthodox economic theory to satisfy equation (1) Saving S= DI-C
where saving S= productive investment I, and
(b)The gross operating
surplus should be the revised figure from the gross domestic product and
expenditure account applying the proposed adjustment for changes in
inventory, and
(c) The current account
entries should appear on both sides
of the national income and outlay account as well as being retained
in the capital account for the reasons set out in Section 4 of this paper, and
(d) The existing
figures for “consumption of fixed capital” (depreciation) should be replaced by
the actual dynamic cash flow “repayments of investment principal”.
(e) When recording National Income and Outlay and
Disposable Income for domestic purposes the trade balance should be deducted
from the Gross Operating Surplus.
Figure 7 compares the
National Disposable Income (DI) for
The proposed revisions
to the National income and outlay account closely reflect the National
Disposable Income figures given in the existing national accounts until 2004.
The preliminary data reveal a large overestimation of disposable income in
2005-2010 [79] despite the negative growth indication
from the balance on the external account. This may be due to the plunging
Savings trend revealed in this paper.
Figure 8 suggests that
domestic growth from 1975 to 1988 and from 2006 to 2009 would be higher than
was officially recorded by the SNA and that from 1989 to 2005 except for 2001
it would be lower than was officially
recorded. The model calibration is not yet sufficiently refined to show this
with any certainty. From 2006 to 2010 the model data hint that the official SNA
national account data have very poorly reflected
[79] The many statistical limitations of the SNA are discussed at United
Nations, 2008, p.396 par 18.11-18.20.
The seven changes
that need to be made to the capital account of the national accounts are:
(a) On the accumulation
side the change in inventories should be set at the lower figure from the gross
domestic product and expenditure account to better reflect their real economic
contribution to GDP, and
(b) “Non SNA qualifying
investment ” needs to be added and
(c) On the finance of
capital accumulation side a new entry “New consumer debt and loss of consumption
capacity to fund change in inventories” needs to be added, and
(d) The existing item
Saving should be replaced by the new item for Saving as outlined in this paper,
and
(e) “Consumption of
fixed capital” should be replaced by “Principal repayments on accumulated
outstanding investment”, and
(f) A new entry
“Reduction in domestic deposits to fund capital goods purchased on the current
account” should be used to account for the current account balance, and
(g) A new entry “New
consumer debt and loss of consumption capacity to fund Non SNA qualifying
investment” should be used for the finance of “Non SNA qualifying
investment” referred to in (b) above.
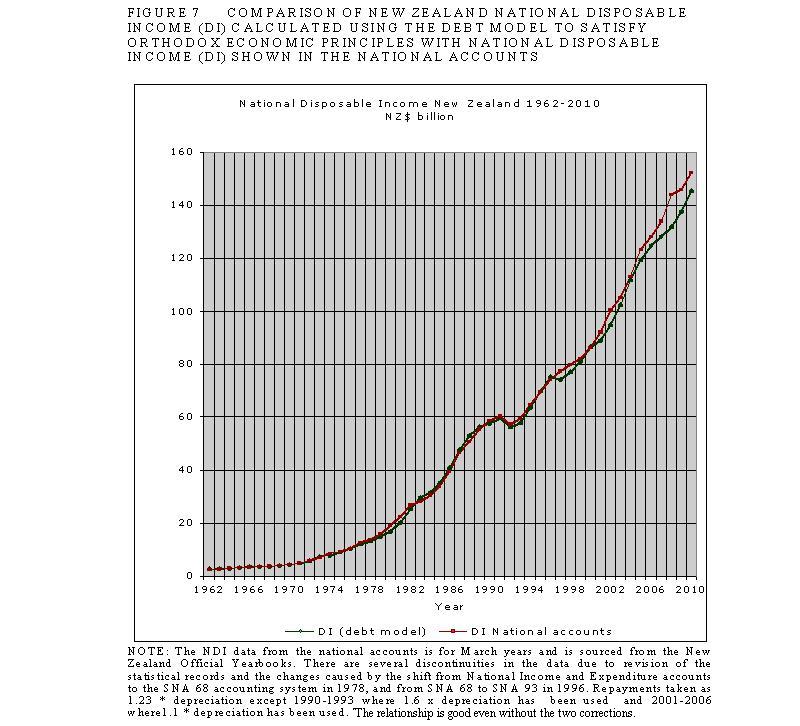
Click here to view : FIGURE 8 : CUMULATIVE BALANCE ON EXTERNAL GOODS AND
SERVICES NEW ZEALAND 1962-2010.
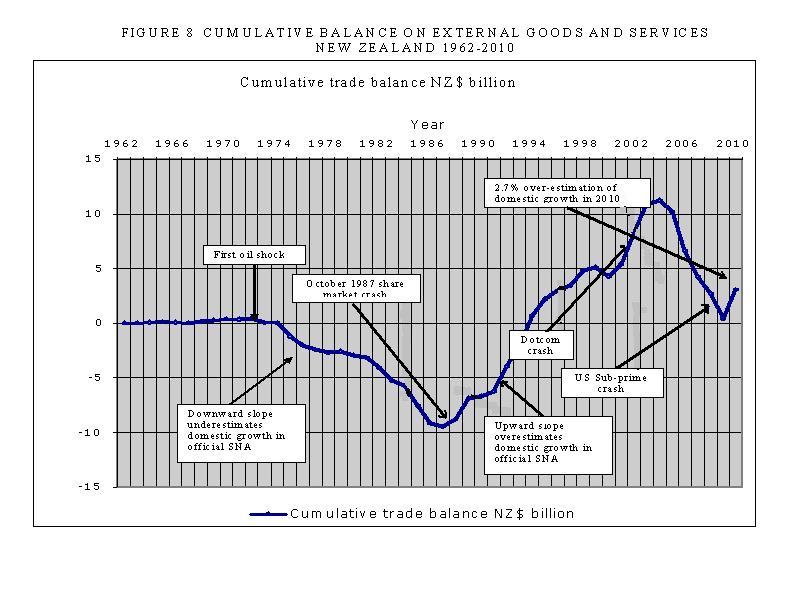
9. CONCLUSION.
The main conclusion
from this paper is that the nature of saving in a debt-based economy is very
poorly understood. That lack of understanding has produced academic literature
and policy frameworks, including the international System of National Accounts
(SNA) itself, that have been catastrophic for modern economies.
At the most basic
level, the international system of national accounts (SNA) presently used to
measure all the world’s economic success is shown to be incorrect in at least
five ways, which are set out in the following comments (a) to (e).
(a) The “saving”
recorded as a residual in the National income and outlay account, for example,
is a myth. This explains the title of this paper. Orthodox economic theory
requires saving to equal investment where investment relates to new productive
investment, not “investment” including existing assets.
New productive
investment is the gross fixed capital formation recorded in the national
accounts. That investment is notionally funded from productive sector incomes.
The net investment is the gross fixed capital formation less the principal
repayments that are made on existing capital goods. So the net productive
Saving according to economic theory must be that new capital formation less the
repayments made out of the gross operating surplus. That is the Saving figure
that must appear in the National income and outlay account. Once that is done,
one of the most basic equations in orthodox economics is satisfied:
S = DI –
C , being [Productive Saving S = Disposable Income DI less Consumption C].
(14)
One
can save neither more nor less than what one earns less what one spends. In aggregate that
saving MUST be invested in new capital goods so as to clear the market of all its
production. It is astounding that for sixty years since the
SNA was introduced the world has worked with a system of national accounts that
is so obviously faulty. Conceptually, those who purchase capital goods
have an accumulated debt to employees and businesses, not to the banking
system. When employees and businesses
accumulate non-productive ‘‘savings” an equivalent amount of bank debt must be
created to replace those “savings”.
(b) The current
account surplus or deficit must be reflected on both sides of the
National income and outlay account. The current account is simply a means of
settling foreign exchange transactions. All that happens is that the mix of
consumption goods and capital goods in the productive economy changes.
The
creditor country swaps surplus consumption goods for an equal amount of capital
goods while the debtor country swaps some of its capital goods for surplus
consumption goods and to pay for other remittances abroad on the current
account. In this process the debtor country initially creates new debt to
pay for the extra consumption and ends up with an equal sum of deposits
received from the sale of its capital goods to balance the foreign exchange
transactions. When the banks’ net foreign currency assets are negative they have
“borrowed” foreign currency to settle their foreign exchange requirements. In
that case, foreign ownership of the domestic economy that would otherwise be
manifested in the sale of domestic assets and corresponding increase in
domestic deposits, has been replaced by foreign currency “debt” in the form of
bonds and commercial paper. It is a liability that leaves the domestic economy
especially vulnerable to the expectations of foreign lenders.
(c) The SNA has
persisted in using depreciation (consumption of fixed capital) instead of
principal repayments in the National income and outlay account. It is
hard to believe the economics fraternity at large did not know depreciation has
little to do with the cash flow that describes incomes and outlay. Depreciation
is not a cash flow. It might be relevant to estimating wealth but has nothing
to do with income or expenditure despite its being used in business profit and
loss accounts.
The use of depreciation for measuring economic success has been
catastrophic for the world economy. As depreciation rates
have been raised, short term profit, and as a result equity values and capital
gains, have increased at the cost of lower
productive Saving and Investment.
This paper is thought
to be the first to identify the link between business profit-seeking and
declining world economic performance through the depreciation mechanism. Higher
depreciation allowances mean higher principal repayments and higher repayments
mean less saving, lower net investment and lower measured GDP growth.
A second major
influence on repayments is population mobility. As people move around much more
than they used to the average life of household mortgages has decreased. Typical
table mortgages have much smaller principal repayments at the start of a
long-term mortgage than they have later in the life of the mortgage. The
mortgage repayment rate underpins most of the “average” repayment of 1.23 times
depreciation used in this paper.
(d) By convention, the
SNA counts increases in inventory (stocks of consumption goods) in the Gross
Domestic Product (GDP). That is understandable if the increases result from
population growth or inflation. Otherwise, they represent a market failure and
a loss to the economy. Consumption prices have been too high to clear the
market of all the available production. That means future sales must be
discounted to clear the increase in inventory, and that, in turn, gives it a
low or even zero economic value.
For the purposes of the
calculations included in this paper the increase in inventory has been
arbitrarily set at zero and the gross operating surplus reduced by the same
amount. That also reduces the National Disposable Income (DI).
(e) The “balance
on external goods and services” in the gross domestic product and expenditure
account of the SNA must be deducted from the gross operating surplus when
calculating National disposable income (NDI). This is to enable the full
current account offset in (b) above to be recorded on both sides of the
account. The National Accounts
set out in the appendices of the UN protocols therefore need to be
systematically reviewed and corrected.
Figure 7 shows that the
use of revisions (a) to (e) in section 8 for the National income and outlay
account yield a NDI for New Zealand that more or less matches the existing DI
produced by the national accounts until 2005. Figure 7 is preliminary because
it is calibrated against the depreciation figures recorded in the existing SNA
accounts.
The major change is not to GDP or to DI but to prospective policy
options for the future. This paper reveals
The existing fixation
on non-productive saving in
On the face of it, GDP cannot increase faster than the Saving rate, so
improving economic performance means increasing transaction deposits (My in the debt model) by simultaneously increasing
incomes and production.
The decline in Saving
in the present financial system is due to the increase in depreciation rates,
moderated by changing population mobility. While some of that can be
attributed to changing technology and rapid obsolescence, the main contributor
has been the self-interest embodied in business focus on short-term profit and
the accompanying permissive regulatory framework that has made high
depreciation rates (and short product durability) possible.
Aggregate economic
performance cannot be improved without changing the underlying business and
banking philosophy in favour of longer-term national growth objectives.
The comments on the New
Zealand Savings Working Group (SWG) report in Appendix 2 illustrate very well
how business self-interest presently takes priority over the national interest.
The “Saving” promoted by SWG and included in the existing SNA format is
economic suicide because, as shown in Figure 6, it adds nothing to the economy
while directly adding to asset inflation, consumer debt, higher inventories,
wage stagnation, increased unemployment and recession.
In the absence of
business leadership, the
BIBLIOGRAPHY.
Federal Reserve Bank of
International Monetary
Fund, 2010a “Balance of Payments and International Investment
Position Manual” Sixth edition (BOPM6), January 2010. http://www.imf.org/external/pubs/ft/bop/2007/bopman6.htm
International Monetary
Fund, 2010b , Blanchard O, Dell’Ariccia G, Mauro P, “Rethinking Macroeconomic
Policy”, IMF Staff Position Note SPN/10/03, February 12, 2010.
Kerin, Paul
(2009) “Forced saving reduces national savings and investment”, The
Australian, 2/3/2009.
New Zealand Treasury,
2011, “Saving New Zealand: Reducing Vulnerabilities and barriers to Growth and
Prosperity”, Savings Working Group Final Report to the Minister of Finance,
January, 2011
OECD, Manual
2009, “Measuring Capital”, 2nd Edition. http://www.oecd.org/dataoecd/16/16/43734711.pdf
Reserve Bank of New Zealand,
1998, Sean Collins, Francisco Nadal Da Simone, David Hargreaves, “The
Current Account Balance: an analysis of the issues” Reserve Bank of New Zealand
Bulletin, Vol 61, No 1, March 1998.
Reserve Bank of New
Zealand, 2001, Ian Woolford, Micahel Reddell and Sean Comber “International
capital flows, external debt and New Zealand financial stability”, Reserve Bank
of New Zealand, Bulletin Vol 64 No 4, December 2001
Reserve Bank of New
Zealand, 2006a, Alan Bollard, Bernard Hodgetts, Phill Briggs, Mark Smith,
“Household savings and wealth in New Zealand”, paper for Alan Bollard’s
presentation to INFINZ, Wellington 27 September, 2006.
Reserve Bank of
Reserve Bank of
Statistics New Zealand,
2006, Geoff Bascand, Jeff Cope, Diane Ramsay, “Selected Issues in the
Measurement of New Zealand’s Saving(s), Paper prepared for the Reserve Bank of
New Zealand Workshop on Saving”, 14 November, 2006.
Statistics
Stiglitz JE, Sen
Amartya, Fitoussi JP (2009), Report by the Commission on the Measurement of
Economic Performance and Social Progress:, September, 2009.
United Nations, 2008,
“System of National Accounts
ACKNOWLEDGEMENTS.
The author gratefully acknowledges
the support, encouragement and advice of Raf Manji and the Sustento Institute
and the constructive critique, editing and advice from Terry Manning and the
NGO Bakens Verzet that have been crucial as this paper has evolved over the
past two years.
APPENDIX 1 : DERIVATION OF THE SAVINGS FUNCTION FROM THE SYSTEM OF
NATIONAL ACCOUNTS.
In this appendix, the
Gross Domestic Product and the National Income and Outlay are analysed in turn and
the differences between them defined. The amount of “ Savings” can then be
calculated.
GROSS DOMESTIC PRODUCT
Gross Domestic Product
(GDP) is the world’s mot most widely used measure of economic
performance. A typical definition is:
“The total market value of goods and services
produced in [a country] after deducting the cost of goods and services utilised
in the process of production, but before deducting allowances for the
consumption of fixed capital.” [80]
Emphasis is on “the
total market value of goods and services” produced by the domestic economy.
Therefore:
Gross Domestic Product
= Compensation of employees (household income).
+ Gross operating Surplus (gross business income
residual).
+ Taxes on production and imports less subsidies (tax
included in prices). (2)
“Production” as stated
in the definition above is an estimated number because the gross operating
surplus that is part of equation (2) is a “residual” accounting figure within
that estimate. “It [the gross
operating surplus] is approximately equal to accounting profit before the
deduction of direct taxes, dividends and bad debts, and before the deduction of
interest paid or the addition of interest received” [81].
“Consumption of fixed
capital” as stated in the definition above is also an accounting entity that
exists only on paper. It is an estimate of the reduction in the nation’s
existing stock of wealth
“used up” during the production process [82]. “Consumption of fixed
capital” is commonly referred to as “depreciation”.
In
practice, calculation of the GDP is usually based on expenditure, which
has two main components.
The first main component of GDP is the sale of the goods
and services produced in the domestic economy. This gives rise to what is
called the “gross national expenditure” (GNE) shown in the expenditure side of
all national accounts:
Gross National
Expenditure = Final consumption (C).
+ Gross capital
formation [83].
+ Change in inventories (increase in stocks).
(3)
The second main component of GDP is the “balance on external
goods and services”. This is usually called the “balance of trade”. It is the
difference between the total exports of goods and services and the total
imports of goods and services. The balance of trade is added to the Gross
National Expenditure to give the total “expenditure” on the gross domestic
product. The balance of trade represents net surplus domestic production
because exports are not, by definition, consumed domestically, while imports
are.
Gross domestic product
(GDP) = Gross national expenditure (GNE).
+
Balance of trade (exports less imports).
+ Statistical discrepancy [84]. (4)
[80] New Zealand Year Book 1988/89 p.809.
[81] New Zealand Year Book 1988/89 p.810.
[82] A typical definition of Consumption of fixed capital is: “The value of depreciation at ordinary rates
allowed for taxation purposes, plus an estimate for the normal rate of
accidental damage based on insurance claims by each industry group.”
[83] In orthodox terms Gross Capital Formation appears to be the same as
domestic Investment while the increase in inventories is also usually treated
as investment by convention rather than because they really do represent
investment.
[84] Required because of errors in the GDP production and expenditure
estimates even though the operating surplus is itself already a residual.
From equations (3) and
(4) and the “expenditure on gross domestic product” side of the gross domestic
product and expenditure account of the national accounts:
Gross Domestic
Product = Final consumption C.
+ Gross fixed capital formation(includes increase in stocks).
+ Balance of
trade (exports less imports).
+ Statistical
discrepancy.
(5)
So:
Final Consumption
C = Gross Domestic Product.
-
Gross fixed capital formation(includes increase in stocks).
-
Balance of trade (exports less imports).
-
Statistical
discrepancy.
(6)
In orthodox economic
terminology a positive balance of trade forms part of national SAVING on the
current account [85]. The corresponding aggregate net
income is called the “balance on the external current account” or, more simply,
the Current Account balance (CA).
[85]
This is clear from the External Account of the National Accounts; for example
Table 1.4 of the New Zealand National Accounts published by Statistics New
Zealand.
In countries where the
current account balance is positive it is made up of domestic deposits in
earners’ accounts and a national foreign currency reserve that results from the
sale of the surplus goods and services offshore. That foreign currency reserve
is then typically “spent” as an OUTWARD CAPITAL INVESTMENT FLOW to debtor
countries. This is part of the process of foreign exchange where the foreign
currency earned by the country with a current account surplus is exchanged for
capital goods in the debtor country. In the absence of outward capital
investment flows the earners’ deposits resulting from the sale of goods and
services offshore would remain in the domestic accounts in the surplus country.
This would cause inflation in the domestic economy of the country that produced
the surplus goods and services. There would be more deposits available than
needed to consume the remaining domestic production at current prices.
NATIONAL INCOME AND
OUTLAY (NDI)
Whereas the Gross
Domestic Product is meant to be about the total MARKET VALUE of goods and
services produced in the domestic economy, the National Disposable Income (NDI)
is defined as “The total income
of [a country] residents from all sources available for final consumption or
savings”. [86]
The income available
for “final consumption or savings” relates to the CASH FLOW in an economy. The
income available for “final consumption and saving” cannot relate directly to
accounting entities like the operating surplus used to calculate GDP because
the operating surplus for GDP purposes is itself dependent on the consumption
of fixed capital. Consumption of fixed capital (depreciation) is a book
accounting entry NOT a cash flow.
In the national
accounts National Disposable Income is related to GDP this way: [87]
NDI (Income
side)
= Compensation of employees (household income).
+ Compensation of employees from rest of world.
+ Gross operating surplus.
+ Indirect taxes less subsidies (tax included in prices).
+ Investment income from the rest of
the world (net).
+ Net current transfers from the rest of the world [88].
- Consumption of fixed capital
(depreciation). (7)
Substituting GDP into
NDI from equation (2) to give the SNA “Principal Aggregates”:
NDI
= GDP.
+ Compensation of employees from rest of world.
+ Investment income from the rest of the world (net).
+ Net current transfers from the rest of the world.
- Consumption of fixed capital (depreciation). (8)
Now that Gross Domestic
Product and the National Income and Outlay have been analysed, “Saving” can be
defined.
[86]
[87]
New Zealand National Accounts Year ended march 2010 Table 1.2 Statistics
New Zealand.
[88]
Current transfers from abroad (e.g. remittances) not included as factor
receipts or compensation of employees from the rest of the world.
SAVING.
On the expenditure side
of the National income and outlay account, Saving S is a residual figure
defined as :
S
= NDI – C
(1)
Where:
NDI is the National
Disposable Income as set out in the national income and outlay account and
C is the total
final consumption expenditure also taken from the national income and outlay
account.
Since depreciation
(consumption of fixed capital) is NOT an income flow but an accounting
correction for the consumption of existing wealth, NDI, as it is presented in
the national accounts, cannot properly represent the dynamic financial FLOWS in
the economy. Using equation 1 and NDI (income side) equation (7):
Saving S = NDI
from equation (7) being:
[ Compensation of employees (household income).
+
Compensation of employees from rest of world.
+ Gross operating
surplus from equation (2) or (5).
+ Indirect taxes less subsidies (tax
included in prices).
+ Investment income from the rest of
the world (net).
+ Net current
transfers from the rest of the world [89].
- Consumption of fixed capital (depreciation). ]
-
Final Consumption C.
(9)
[89] Current transfers from abroad (e.g. remittances) not included as factor
receipts or compensation of employees from the rest of the world.
From the GDP derivation
equations (2) and (5) above:
Compensation of
employees (household income).
+ Gross operating Surplus (gross business
income residual).
+ Taxes on production and imports less
subsidies (tax included in prices). (2)
=
Final consumption C.
+ Gross fixed capital formation(includes
increase in stocks).
+ Balance of trade (exports less imports).
+ Statistical
discrepancy.
(5)
And so:
Final Consumption
C = Compensation of
employees (household income).
+ Operating Surplus (gross business income
residual).
+ Taxes on production and imports less
subsidies (tax included in prices) .
- Gross capital formation (including
increase in stocks)[90].
- Balance of trade (exports less
imports).
- Statistical discrepancy
[91].
(10)
[90]
Gross capital formation is the same as Investment - the increase in
stocks is also usually treated as investment by convention.
[91]
Required because of errors in the GDP production and expenditure estimates even
though the operating surplus is itself already a residual.
Substituting for final
consumption C equation (10) into the above saving equation (9):
Savings
S
= Compensation of employees (household income).
+ Compensation of employees from rest of
world.
+ Operating Surplus (gross business
income residual).
+ Indirect taxes less subsidies (tax
included in prices).
+ Investment income from the rest of the
world (net) [92].
+ Net current transfers from the rest of
the world [93].
- Consumption of fixed
capital (depreciation).
- Compensation of employees.
- Operating Surplus (gross
business income residual).
- Indirect taxes less
subsidies (tax included in prices).
+ Gross capital formation (including
increase in stocks) [94].
+ Balance of trade (exports – imports).
+ Statistical discrepancy [95].
(11)
[92]
Net income from abroad in the form of interest, dividends rent and royalties.
NZYB op. cit. p.811.
[93]
Current transfers from abroad (e.g. remittances) not included as factor
receipts. NZYB op. cit. p.811.
[94]
Gross capital formation is the same as Investment - the increase in
stocks is also usually treated as investment by convention.
[95]
Required because of errors in the GDP production and expenditure estimates even
though the operating surplus is itself already a residual.
The current account
surplus (CA), the balance on the current account, is defined as :
CA [96]
=
Balance of trade (exports less imports).
+ Compensation of employees from
rest of world
(net).
+ Investment income from the rest of
the world (net).
+ Net current transfers from the
rest of the world.
(12)
So, according to the
SNA and substituting the balance on current account (the right hand side of
equation (12) into equation (11) for Saving:
Saving S
= Current account surplus (CA).
+ Gross capital formation
(including increase in stocks) [97].
- Consumption of fixed
capital (depreciation).
+ Statistical discrepancy
[98]. (13)
[96]
New Zealand National Accounts Year ended March 2010. Table 1.4
[Statistics
[97]
Gross capital formation is the same as Investment - the increase in
stocks is also usually treated as investment by convention
[98] Required
because of errors in the GDP production and expenditure estimates even though
the operating surplus is itself already a residual.
The saving figure S in
the national accounts is a net figure because depreciation has been deducted.
Gross Saving is obtained by adding back the depreciation figure.
There is no place in Saving S for “savings" deposits like the
Cullen Superannuation Fund and Kiwisaver in
APPENDIX
2. COMMENTS ON THE NEW ZEALAND SAVINGS WORKING GROUP (SWG) REPORT
TO THE MINISTER OF FINANCE JANUARY 2011.
In January
The report is more than
150 pages long but fails to get to the core of the savings issue as set out in
this paper.
This section offers
some brief comments on the report.
(1) SWG records that
measured household “saving” in
(2) Nowhere in the SWG
report is the role of domestic bank debt in investment adequately dealt with.
Household debt is discussed on page 8 but no effort is made to explain what has
caused the debt explosion around the world. The debt model fully explains this
process.
(3) The SWG
recommendation to increase national “saving” by 2 to 3% is arbitrary. The
authors first need to understand what national “saving” in the SNA is. They
show little sign they understand the system mechanics that give rise to the official
figures. Nor do they properly distinguish between the nature of productive
investment and the nature of non-productive investment that destroys the
productive economy instead of stimulating it.
(4) In orthodox
theory all investment is funded from "saving" according to SWG Box
11. There, net investment (Inet) is equal to National saving S (the saving
figure that appears as a residual in the national accounts) + Foreign
investment (Srow) from the rest of the world (the current account deficit return
capital flow). This paper shows that neither of those items represents saving
in the sense of providing the funding base for productive investment. Instead,
in the debt system, debt is initially used to produce capital goods and those
goods are then "consumed" in the sense of being paid for out of
productive economy incomes. Conceptually, the orthodox saving = investment
involves the exchange of production entitlements within the productive sector.
Producers own the part of the capital goods they produce and, through bank
intermediation, they sell their share to others wishing to buy it
(5) The main
problem with treating the current account surplus Srow referred to by SWG as an
investment is that it represents a return capital flow. This return flow arises
from consumer debt taken on in the debtor country to pay for extra consumption
of imported goods and services. Some of the Srow amount may be used for
productive investment and some of it is used as foreign direct investment (FDI)
to buy existing non-productive assets like residential land and houses. Most
Srow is used to buy existing assets. The sellers of those assets do not always
use their resulting deposits for productive investment in
(6) Debt cannot be
"saved" because it is always cheaper to repay debt than hold a
"savings" deposit. Instead in the debt model deposits typically drain
away from debt-holders to the investment sector as UNEARNED income that forms
the deposit pool (Ms in the debt model) that operates outside of the productive
economy. From the dynamic economic flow perspective of the national accounts,
that drift from the productive economy to the non-productive “paper” economy
appears as systemic inflation in both the income and expenditure sides of the
production cycle.
(7) The SWG note at
P.140/141 Figures 9.12 and 9.13 that real market income has actually fallen for
half the population in
(i) Debt servicing has
increased dramatically over the years because there is so much more debt,
substantially reducing the purchasing power of incomes [99].
(ii) Total taxation has
also increased with a similar effect though some of that effect is offset for
some people by higher transfer payments. Governments frequently claim the
public gets "value for money" for taxation. SWG wants to make a major
attack on government "productivity" because it does not share the
government’s view.
(iii) Many goods and
services previously un-priced are now priced. These effects can be estimated.
The main point is that the changes all work in the same direction and reflect
the dramatic shift in wealth from the poor to the rich that has taken place in
recent decades [100].
[99]
This is demonstrated graphically in papers 1 and 2 referred to at the beginning
of the introduction Section 2 of this paper.
[100]
This is discussed fully in the paper How to create stable financial
systems in four complementary steps.
(8) Existing National “saving”
S in the national accounts is made up of sector saving (household, business,
government), but all three are forms of household saving. Government saving can
be viewed typically as over-taxation. Business saving can be seen as retained
earnings that would otherwise have been income to the entrepreneurial household
sector. S is meant to reflect income that is not spent on consumption. The debt
model and this paper show that in the absence of deflation it is not possible
for productive income earners and businesses to "save" more of their
incomes than is needed to buy the capital goods being produced unless
households, in aggregate, borrow the difference. Some people can save … at
someone else’s expense…. but collectively there can be no “saving” for non-productive
“investment” in the paper economy without compensatory formation of new debt.
Otherwise the economy will collapse because the market cannot clear. If
the government and businesses "save" the household sector will
correspondingly dis-save. [ SWG p.120-125].
(9) The question
then arises why net National “Saving” S as presented in the NZ national
accounts has "wobbled" through a rather wide spectrum. Over the
past 30 years according to the SWG report it has varied from a low of -1.3% of
GDP in 1992 to a high of 5.4% of GDP in 2002 and 2004 at the
beginning of the last expansion.
The main answer is that
the SNA itself is wrong. The basic formula S = NDI-C, equation
(10) Over the past 60
years or so since the SNA was developed, the erroneous use of depreciation has
caused irreconcilable problems around economic theory and policy, and the whole
concept of savings in theory and their measurement needs to be revisited. The
economics profession will need to accept the principle that “saving” that
is not used for productive investment withdraws money from circulation and
causes either deflation or economic contraction. Since virtually every country
has some degree of inflation in that the money supply is increasing relative to
production, the world must be dis-saving, that is, taking on more and more debt
to prop up the non-productive investment sector, just as the debt model
indicates.
(11) Money has been
widely hoarded for many centuries, but that was when there was little or no
debt. If too many people hoarded too much money there would be very little cash
in circulation and prices would fall. There is plenty of evidence the original
Fisher equation applied well to cash economies, but it is difficult to prove
conclusively because of the potential margins of cumulative error in the
painstakingly assessed macroeconomic aggregates. The economy was still largely
run on cash when the SNA was established at the end of World War II. It was
common to stash some cash away. Even now, most of the NZ$ 3.6b cash "in
circulation" in NZ (NZ$ 800 per person!) seems to be hoarded in the
"black" market. The best way to encourage "saving" would be
to abolish the debt system and use electronic cash E-notes instead. Hoarded
E-notes would be replaced with new ones to maintain the price level.
Surplus E-notes could be removed by taxation. The key difference is that there
is no debt to repay and no interest on the debt, and so the saving would be
real.
(12) Standard banking
practice requires principal repayments greater than the depreciation rate.
Otherwise there could still be debt outstanding after the asset, against which
the loan is often raised, has reached the end of its useful life. At that point
there would be no loan security left. For that reason, in NZ, home mortgages do
not usually go beyond 30 years these days while the depreciation rate is
typically around 3%. As discussed in this paper, the National Accounts are
substantially UNDERCOUNTING the repayment cash flow by using depreciation
instead of principal repayments. SWG records an "average" figure for
savings S in recent decades in
(13) It is reasonable
to expect principal repayments to run at about 23% above the depreciation
figure in
(14) There will be some
cyclical variation in repayments, particularly during recessions when the
repayments are likely to be higher because of defaults and bank losses. This
seems to have been the case in NZ between 1990 and 1993. Similarly,
repayments might be lower in times of rapid expansion as seems to have been the
case in the dotcom boom 2000-2002. There is no particular reason why the
capital repayments percentage would be the same country to country, but
(15) SWG argues
for more “saving” as well as a budget surplus. It proposes that government
should "increase productivity by 2% a year for five years and 1%
thereafter" (p.8) to achieve the surplus. It does all this is while
arguing later in the paper for extra bureaucracy that is supposed to increase
efficiency. It is very difficult to improve efficiency in a service-dominated
economy that isn't based on industry or agriculture where science and
technology play a major role. There can be improvement in service delivery (in
health for example; better equipment, shorter hospital stays and so on) but at
the basic level public interaction remains mostly 1:1 and net efficiency gains
will always be marginal.
The SWG report refers
at
(16) SWG pays little
attention to what people who “save”, “save” for, assuming they could save. SWG
says savings is primarily for the middle-income group to be able to have the
same quality of life in retirement enjoyed while working. Saving is,
apparently, viewed as a reserve for future consumption, not for productive
investment. That means future inflation would be caused by the reintroduction
of funds into circulation for consumption. It would then tend to reverse the
deflationary tendency caused by the withdrawal of funds for “saving” in the
first place. Lower income groups are supposed to be satisfied with national
superannuation. But SWG fails to explain why people who have struggled
throughout their working lives shouldn’t have something BETTER to look forward
to. When household “saving” is invested in pension funds and other savings
institutions that in turn invest mostly in existing assets, the real winners
from “saving” would be the elite who hold shares and directorships in companies
and speculators, not those with wage and salary incomes. The report itself
acknowledges most people are no better off in
(17) SWG claims
"The fastest way to stabilise the NFL (Net foreign liabilities)-GDP ratio
is to return the fiscal balance to surplus earlier than current
projections".
The New Zealand Labour
government ran large fiscal surpluses. At the same time there were persistent
record current account deficits. The SWG position is therefore ideological. If
their "argument" were applied it would make more sense for the
government to run very large deficits. And on p.12 SWG says:
"Reducing borrowing is - to some extent - an alternative means of
increasing saving and wealth". There is no comment on how saving and
wealth can be increased in a debt-based economy without increasing debt.
SWG may be referring to
foreign borrowing. If so, it would be inappropriate to consider inward
compensatory capital flows to the debtor country
Productive investment
comes from new debt created during the production cycle itself that is then
notionally retired when the business operating surplus is distributed and the
capital goods are “sold”. This paper shows that foreign “saving”, (SWG calls it
Srow), plays no relevant part in productive investment and that saving and
productive investment are both independent of the current account.
(18) SWG writes at
p.40: "The build up of NFL and the inflation pressure from the imbalance
between domestic investment and saving are the most likely explanations for
According to orthodox
theory there can be no such imbalance because “Savings equals
Investment”. SWG admits in reality in the quote that it doesn't have an
explanation for
The SWG does not
mention the main contribution to high interest rates in
(19) SWG states on p.19
of its report : "The main saving issue for
The SWG statement needs
to be treated with a great deal of scepticism, if not dismay. This paper shows
that foreign “savings” do not usually build productive capital stock. If
(20) Nor does the SWG
make sense with its comments on p.12 of its report, relating to tax rates
favouring housing. Some countries such as The Netherlands have tax
deductibility for mortgage payments without any sign of a housing bubble. That
is because they have a lower interest rate structure and so the exponential
debt expansion and growth of the non-productive investment sector is slower
(see: The interest-bearing debt system and its economic impacts.)
Blaming immigration for
rising house prices is also incorrect. Housing demand caused by new
household formation affects the supply of new dwellings but it does NOT drive
property prices. The land price drives property prices. Land prices
reflect investment sector expansion. Any change in building costs appears in
the ordinary inflation figures. The SWG recommendation to substantially
reduce tax rates on non-residential investment by 5% to 10% would boost the wealth
of the rich at the expense of the poor just like its recommendations
on Kiwisaver and Superfund. SWG acknowledges at p.103 that home ownership
is declining. Increasing tax on homeowners would make home affordability worse,
not better. It would make it even more difficult for first home buyers to buy
their own home than is already the case in
(21) This paper
shows there is no “saving” under the SNA in terms of the cash FLOW in the
economy. There is an ongoing structural transfer of wealth from those holding
debt to those with deposits in the banking system. SWG (pp. 26-29)
appears to be confused in its understanding of the processes taking place in
the debt based economy. Households can't rapidly increase their debt and be
saving at the same time. Instead, the cost of their debt SERVICING shifts
claims on wealth to the non-productive investment sector. That leaves ever more
deposits in the “paper” economy. More money in the “paper” economy means
investment prices there will rise. This conforms to the Fisher equation in its
purest form. The secondary effect for homeowners is that their property
"values" go up and their nominal wealth may go up despite their
dis-saving. The effect for first home buyers throughout most of the industrialised
world is that there is no way a single-earner, and sometimes even a household
with two incomes, can afford to buy a house.
(22) SWG discusses
the PAYGO (“pay as you go”) superannuation system versus SAYGO (“save as you
go” funded schemes, as in
There are issues of
intergenerational equity with SAYGO systems too, where the current generation
would be (indirectly) subsidising later ones. The same investment (SAYGO) error
is being perpetuated in
(23) At p.36 of
its report, SWG writes "The relationships between main local banks and
their parents in
SWG’s statement is
inaccurate. The banks have not “remained open” for households and consumers.
Their extra bank spread in recent years largely created the recession in
(24) SWG refers
(pp. 59-64) to NZIER (New Zealand Institute of Economic Research) modelling
work on export performance saving, interest and GDP. That work is unhelpful
because it assumes 5% nominal GDP growth that is unlikely to be achieved in the
foreseeable future. Under the existing economic policy instruments, increases
in interest rates would collapse the economy before it could sustain a 5%
growth rate [102].
[101]
This is discussed in How to create stable financial
systems in four complementary steps .
[102]
This is discussed in How to create stable financial
systems in four complementary steps .
Tax changes do not
necessarily change national “saving" as it is defined either, as the SWG
claims on p. 77. This is because the demand for imported goods and services is
not necessarily a direct function of net disposable income.
(26) At p.134 of
its report SWG notes that: "Household borrowing has been a major
contributor to the lift in
END APPENDIX 2.
For more information on
monetary reform :
NEW Capital is debt.
NEW Comments on the IMF (Benes and Kumhof) paper “The
Chicago Plan Revisited”.
DNA of the debt-based economy.
General summary of all papers published.(Revised edition).
How to create stable financial systems in four
complementary steps. (Revised edition).
How to introduce an e-money financed virtual minimum wage
system in New Zealand. (Revised edition) .
How
to introduce a guaranteed minimum income in New Zealand. (Revised edition).
Interest-bearing debt system and its economic impacts.
(Revised edition).
Manifesto of 95 principles of the debt-based economy.
The Manning plan for permanent debt reduction in the national economy.
Missing links between growth, saving, deposits and
GDP.
Savings Myth. (Revised edition).
Unified text of the manifesto of the debt-based
economy.
Using a foreign transactions surcharge (FTS) to manage the
exchange rate.
(The
following items have not been revised. They show the historic development of
the work. )
Financial system mechanics explained for the first time. “The Ripple
Starts Here.”
Short summary of the paper The Ripple Starts Here.
Financial system mechanics: Power-point presentation.
Return to : Bakensverzet homepage
"Money is not the
key that opens the gates of the market but the bolt that bars them."
Gesell, Silvio, The Natural
Economic Order, revised English edition, Peter Owen,
This work is licensed
under a Creative Commons Attribution-Non-commercial Share-Alike
3.0 Licence.