NGO Another Way (Stichting Bakens Verzet), 1018
AM
01. E-course :
Diploma in Integrated Development (Dip. Int.Dev.)
Edition 22: 15 January, 2011
![]()
Study points : 05 points out of 18
Minimum study time : 125 hours out of 504
The study points are awarded upon passing the
consolidated exam for Section C : The Model.
[Study points 03 out of
18]
[Minimum study time: 85 hours out of 504]
The study points are awarded upon passing the
consolidated exam for Section C : The Model.
Sect. 3 : Costs and benefits
analysis. [17 hours ]
01. Introduction. (02 hours)
02. The investments made.(02 hours)
03. Detailed results. (02 hours)
04. Efficiency and effectiveness. (02 hours)
05. Management costs.(02 hours)
06. Costs and benefits analysis :
introduction. (02 hours)
07. Costs and benefits analysis : details. (02
hours)
08. Kyoto Protocol : analysis possibilities finance. (Additional)
Section 3 report: (03 hours).
Sect. 3 : Costs and benefits
analysis. [17 hours ]
08. Kyoto Protocol : analysis possibilities financing. (Additional)
This analysis has ten sections:
SECTION 00. EXECUTIVE SUMMARY.
SECTION
01. INTRODUCTION.
SECTION 02. POTENTIAL AREAS OF APPLICATION OF CDM
MECHANISMS TO INTEGRATED DEVELOPMENT PROJECTS.
SECTION 03. SMALL SCALE CDM ACTIVITIES.
SECTION 04. PROGRAMMES OF ACTIVITIES.
SECTION 05. SELECTION OF
THE CDM meTHODLOGIES FOR THE APPLICATIONS LISTED IN SECTION 2.
SECTION 06. INFORMATION SPECIFIC TO AFFORESTATION AND REFORESTATION (AR)
METHODOLOGIES SPECIFICALLY APPLICABLE TO INTEGRATED DEVELOPMENT PROJECTS.
SECTION 07. NOTES SPECIFIC TO THE ROLE OF BAMBOO IN
AFFORESTATION AND REFORESTATION PROJECTS.
SECTION 08. CDM FUNDING INDICATIONS FOR THE SELECTED METHODOLOGIES.
SECTION 09. GRAPHS AND CONCLUSIONS.
SECTION 00. EXECUTIVE SUMMARY.
Ecological,
sustainable, local integrated development projects for the world’s poor provide
simple, down-to-earth practical solutions to poverty- and development-related
problems in individual project areas each with about 50.000 inhabitants.
Social, financial, productive and service structures are set up in each project
area in a critical order of sequence and carefully integrated with each other.
That way, cooperative, interest-free, inflation-free local economic environments are formed
there so that local initiative and true competition are free to flourish. The
execution of each integrated development project meets and surpasses the objectives of all eight of the
millennium development goals in its project area, with the exception of
vaccination campaigns and curative medicine.
Integrated
development projects provide all the
services necessary for a good quality of life for all of the inhabitants in
their project area. Each project in non-pastoralist areas costs about Euro
5.000.000, of which 25% is provided by the inhabitants themselves by way of
work carried out under local money systems set up in an early phase of project
execution. This leaves a formal money (Euros) initial financial requirement of
about Euro 3.750.000 per project. Projects in pastoralist areas on the other
hand cost about Euro 7.000.000 each of which 20% is provided by the inhabitants
themselves by way of work carried out under local money systems set up in an
early phase of project execution. This
leaves a formal money (Euros) initial financial requirement for pastoralist
areas of about Euro 5.600.000 per project. The difference between pastoralist
and non-pastoralist areas is determined by the additional drinking water and
food supply requirements of herds in pastoralist areas.
Some 2500
integrated development projects are needed for the integrated development of
West Africa (excluding
The initial
financial requirements of respectively Euro 3.750.000 (non-pastoralist areas)
and Euro 5.600.000 (pastoralist areas) must be deposited up-front to cover
project execution over the two-year period foreseen for that purpose. This
initial capital can be reimbursed over the following years through funds
provided by the sale of certified emission reduction (CER) units issued under
the Clean Development Mechanism (CDM) system set up under the Kyoto
Protocol.
This is possible
through the application of batches of small-scale Clean Development Mechanisms
(CDM) methodologies common to all individual integrated development projects
and based on Programmes of Activities (PoA) organised in two layers.
The first level
Programme of Activities (PoA) is the mother PoA. For the integrated development
of, say, West Africa (excluding
The second level
comprises a batch of 13 Programmes of Activities (PoAs) each using a specific
CDM methodology. Each of the 2500 individual integrated projects may choose to
apply any one, any combination, or all of the 13 second level PoAs in
accordance with the local requirements there. For instance, one project area
may apply methodology AR AMS-003, Version 1 for the reforestation of wetlands, another may
choose to apply AR-AMS-0005 (Version 2, 8
April 2009) in an area with low inherent potential to support living
biomass, while a third project area with both wet and very dry areas may choose
to apply both methodologies.
The scheme with two layers of PoAs proposed here is
different from anything done under the CDM mechanism until now. It will take
time, financial investment, and full engagement at sub-regional level to get it
accepted by the Executive Board of the Clean Development Mechanism. That
acceptance could lead to a breakthrough in the financing of projects for the
integrated development of the world’s poorest countries. Promotion of the
proposal is a high risk enterprise involving substantial costs which must be paid
up front without guarantee of success.
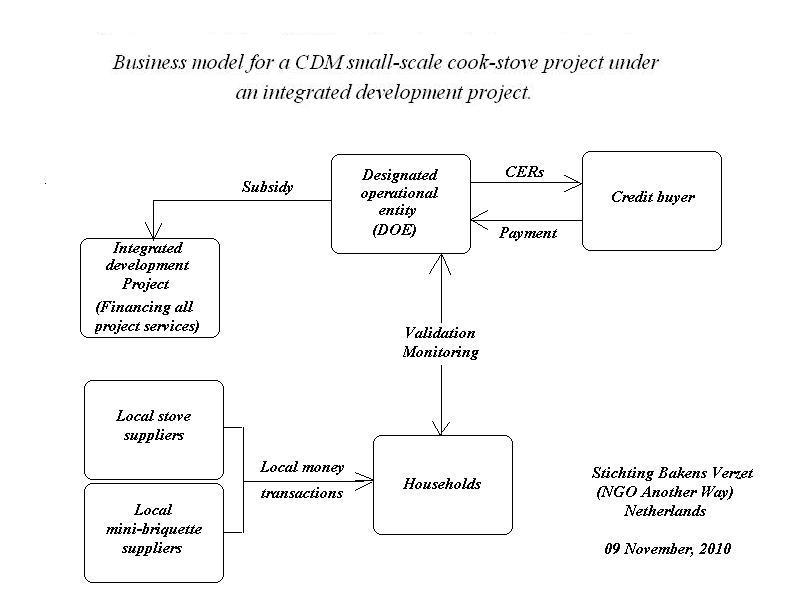
There are two main sectors for intervention under the
CDM mechanism. The first one is CDM funding through reduction of CO2 emissions
in project areas through the use of improved cooking stoves, more efficient lighting
systems and switches from non-renewable biomass to renewable biomass and
similar. The second one is CDM funding through increase of CO2 sinks through
various afforestation and reforestation projects.
A preliminary analysis shows that
the potential total average gross CDM income over 50 years for each integrated
development project could be Euro 26.315.233. This
is a cautious non-scientific initial approximation.
It is subject to the deduction of at least 10% to cover
administration and validation costs. It is expressed in present day Euros and
based on CO2/tonne values on 14th November 2009 (about € 14 per
tonne CO2). It is, therefore, not discounted over 10-20 year periods according
to traditional cost-benefit calculation practices. It assumes annual validation
by the CDM Designated Operational Entity (DOE), while various CDM methodologies
currently prescribe different validation periods. It also assumes enough water
and labour is available to start the various afforestation/reforestation projects
more or less contemporaneously. If this is not so, they may need to be
phased.
A first level (mother) PoA with
2.500 applications representing 2.500 individual integrated development project
areas (125.000.000 people) could generate up to € 65.788.082.000 of CDM
funding. This would eliminate poverty in the areas concerned and surpass all of
the millennium development goals there except those relating to vaccinations
and curative medecines.
Click here to view a general graph showing annual distribution of expected
gross CDM income for each individual integrated development project area .
The graph is intended to show
that, whatever happens and however the calculations are made, each individual integrated
development project can
repay its initial capital cost investments over just a few years of operation.
Indicative incomes are gross of
DOE validation and administration costs. An allowance of at least 10% should
therefore be made to cover these costs. So the net figures from the
preceding paragraph are :
Total expected net CDM income per
project Euro 23.683.709.
Expected net CDM income relative
to second year Euro 488.597.
Expected net CDM income relative
to third year Euro 1.156.854.
Expected net CDM income relative
to fourth year Euro 1.497.150
Expected net CDM income relative
to fifth year Euro 1.441.510
Expected net CDM income relative
to sixth year Euro 1.126.510
These indicative CDM incomes are
subject to substantial change where, because of limitations in water supply
and/or labour, activities have to be phased in. In that case the general total
does not change, but the rate of repayment would be lower and the repayment
spread over a longer period.
Not all of the
potential CDM funding capacity has been absorbed. It has been assumed that more
projects will use application 07 AR-AMS-0005 (Version 2, 8
April 2009) for very dry
areas with Jatropha, than application AR AMS-003, Version 1 for
wetlands with mangroves, which give a much higher CDM return. Use of methodology
AMS-III-AR for methane recovery has been rated at zero until
advice on the energy applications it could replace is received. The use of
methodology AMS-III-AJ for the
recycling of plastics and other materials has been rated at zero until
information on the quantities of materials typically available for recycling is
received. This aspect is discussed in
more detail in section 01. Introduction.
How rapidly the initial capital input of integrated
development projects is repaid under the CDM mechanism is a political issue. A
regional project owner such as ECOWAS/UEMOA may make a call on 100% of CDM
funds as they come in, or may accept for example repayment of 50%, allowing the
remaining 50% to be distributed amongst the populations in the project areas,
or any other combination of the two. Partial distribution of funds to the
populations provides them encouragement and would form a great stimulus. Rapid
re-entry of funds on the other hand provides revolving finance for new
integrated development projects and more rapid execution of all projects
included in the regional development plan in question.
Subject to the
above comments, expected net CDM incomes projects in non-pastoralist areas with
an initial capital input of Euro 3.750.000 would in principle enable repayment
of the initial capital input fully repaid during the sixth year of activities, on the basis
of CDM income from the first five years. In non-pastoralist areas with an
initial capital input of Euro 5.600.000 the initial capital input could in
principle be fully repaid at the end of the seventh
year of activities, on the basis of CDM income from the first six years.
Once the initial
capital for a given integrated development project has been repaid, all
remaining CDM income is paid from time to time to the project’s Cooperative for
the On-going Administration of the Project Structures (of which all adults in
the project area are members) and either equally distributed amongst the
members or used to cover extensions to project structures.
The full amount of the initial project capital necessary
for the execution of each integrated development project must always be paid up front.
The proposed
programme of CDM applications provides many major benefits to the local
populations as well as funds to pay for their integrated development projects.
Food safety is greatly increased through the supply of fruit and nuts and
hedgerows for protecting crops in semi-arid and arid areas. The bamboo
plantations provide food in the form of bamboo shoots, material for uncountable
productive activities, and biomass for the production of mini-briquettes for
cooking purposes. Moringa trees provide “spinach leaves” for food, edible oils
for cooking, and moringa paste for water purification purposes. The Jatropha
produces limited amounts of bio-fuel to drive local generators and equipment.
All CDM activities improve the quality of the environment and maintain
bio-diversity. All these benefits are all in addition to those already listed
in the report on costs and benefits which is part of the Model for Integrated
Development Projects.
Graphs showing details of the
expected gross CDM income for each of the first nine years of project operation
, as well as those for each of the various applications foreseen ,are available
in Section 09 below.
A typical sub-regional integrated
development plan with CDM funding is shown in a structural proposal for West Africa.
Table 1 shows the plan of Mother
PoA and sub-PoAs. For the development of
Table 1 : The two
Programme of Activities (PoA) layers.
|
Year of operation |
Sub-PoA |
01 |
02 |
03 |
04 |
05 |
06 |
07 |
08 |
09 |
10 |
11 |
12 |
13 |
14 |
15 |
16 |
17 |
18 |
19 |
20 |
21 |
22 |
|
Mother PoA |
01.
CO2 savings reduced use of non-renewable biomass for cooking purposes through
the introduction of improved stoves. AMS-II-G.(Version 2) (50 years) |
|
x |
x |
x |
x |
x |
x |
x |
x |
x |
x |
x |
x |
x |
x |
x |
x |
x |
x |
x |
x |
x |
|
02.
Demonstration projects for the recovery of forest lands and natural parks and
reserves. AR-AMS-0004 , version
2. (50 years) |
|
x |
x |
x |
x |
x |
x |
x |
x |
x |
x |
x |
x |
x |
x |
x |
x |
x |
x |
x |
x |
x |
|
|
03.
Afforestation activities in settlements as defined Distributed planting of fruit and nut trees
and similar. AR-AMS-2 (version 2) |
|
x |
x |
x |
x |
x |
x |
x |
x |
x |
x |
x |
x |
x |
x |
x |
x |
x |
x |
x |
x |
x |
|
|
04.
Small-scale agro-forestry activities – such as distributed bamboo plantations
on grasslands and croplands. AR-AMS-0001 |
|
x |
x |
x |
x |
x |
x |
x |
|
|
|
|
|
|
|
|
|
|
|
|
|
|
|
|
05
Small-scale agro-forestry activities – distributed demonstration Moringa
plantations on marginal lands, AR-AMS-0004 , version
2. |
|
x |
x |
x |
x |
|
|
|
|
|
|
|
|
|
|
|
|
|
|
|
|
|
|
|
06.
Demonstration afforestation and/or reforestation (AR) projects on wetlands
using traditional species. AR AMS-003, Version 1. (30 years) |
|
x |
x |
x |
x |
x |
x |
x |
x |
x |
x |
x |
x |
x |
x |
x |
x |
x |
x |
x |
x |
x |
|
|
07 Demonstration Jatropha projects on lands
having low inherent potential to support living biomass. AR-AMS-0005 (Version 2, 8
April 2009) |
|
x |
x |
x |
x |
x |
x |
x |
|
|
|
|
|
|
|
|
|
|
|
|
|
|
|
|
08.
Use of renewable biomass instead of non-renewable biomass with improved cook
stoves. AMS 1.E . |
|
x |
x |
x |
x |
x |
x |
x |
x |
x |
x |
x |
x |
x |
x |
x |
x |
x |
x |
x |
x |
x |
|
|
09. Recycling
of human waste to avoid the use of industrial fertilisers AMS-III-Y |
|
x |
x |
x |
x |
x |
x |
x |
x |
x |
x |
x |
x |
x |
x |
x |
x |
x |
x |
x |
x |
x |
|
|
10.
Methane recovery from animal waste for cooking and lighting purposes
especially in pastoralist areas. AMS-III-AR
(Reserve pending
applications) |
|
|
|
|
|
|
|
|
|
|
|
|
|
|
|
|
|
|
|
|
|
|
|
|
11. Replacement
of kerosene lamps etc (wind, solar and/or renewable bio-mass including plant
oil, gasification of biomass). Methodology AMS-III-AR |
|
x |
x |
x |
x |
x |
x |
x |
x |
x |
x |
x |
x |
x |
x |
x |
x |
x |
x |
x |
x |
x |
|
|
12.
Replacement of non-renewable electrical, diesel- and battery-driven sources
for mechanical equipment AMS-I-A |
|
x |
x |
x |
x |
x |
x |
x |
x |
x |
x |
x |
x |
x |
x |
x |
x |
x |
x |
x |
x |
x |
|
|
13. Local
recycling and recovery of materials from solid wastes, including but not
limited to plastics. AMS-III-AJ.
(Reserve pending applications) |
|
|
|
|
|
|
|
|
|
|
|
|
|
|
|
|
|
|
|
|
|
|
SECTION 01. INTRODUCTION.
01.
Introduction.
A "certified emission reduction" or
"CER" is a unit representing one ton of carbon dioxide-equivalent (CO2-e)
sequestered or abated, using global warming potentials
defined by 2/CP.3. CERs are issued to project participants in CDM
projects under Article 12 of the Kyoto Protocol and the CDM modalities and
procedures (3/CMP.1, Annex, paragraph 1(b)).The
value of CERs varies sharply over time. Prices on 14th November 2009
were about € 14 per ton.
The main source
for information on the Clean Development Mechanism (CDM) is the CDM website of the United Nations Framework Convention on
Climate Change (UNFCCC). Many will find the Rulebook : Clean Development Mechanisms Rules, Practices
and Procedures developed by Baker and McKenzie for the www.cdmrulebook.org website easier to
navigate. The Baker and McKenzie
rulebook includes an A-Z index of key words which is easy to consult. The www.cdmrulebook.org
site is not, however, complete. For instance, it says what a Designated
Operational Entity (DOE) is, but does not provide a list of approved DOEs. The list of DOEs can instead be found at the
UNFCCC site. There are currently 48 of them. Most of them are based in
industrialised countries, though there are some in “emerging” countries too.
Designated Operational Entities (DOEs) intermediate between the people
proposing a project and the CDM Executive Board which approves it. They
evaluate and validate initial project applications and carry out periodic
inspection and certification activities ensuring on-going compliance. Most of
these DOEs are large international
institutions which in practice are given (hold) a virtual licence to
complicate or facilitate procedures. Project proponents are placed at their
mercy. Furthermore, if the issuing organ
(in the case of CDM projects, the Executive Board) makes an arbitrary
decision either with regard to registration or to issuance of certificates,
applicants have no remedy. In December
2010 there was still no CDM appellate body
to handle appeals against the decisions of the CDM Executive Board. A
preliminary discussion on this issue took place during the UNFCCC meeting in
Cancun (
Recently
introduced Programmes of Activities (PoA) appear to offer greater potential for
CDM financing of integrated development projects in developing countries. A programme of activities defines parameters
for CDM activities to be included in the programme. It is a sort of convention.
Once registered by the CDM Executive Board, the PoA applies to activities
brought under it from time to time without the need for project by project
applications. For more information refer to : Beaurain F., Schmidt-Traub
G, Developing CDM Programmes of
Activities : A Guidebook, South Pole Carbon Asset Management Ltd,
Zurich, 2010. “As of November 2010, after EB meeting
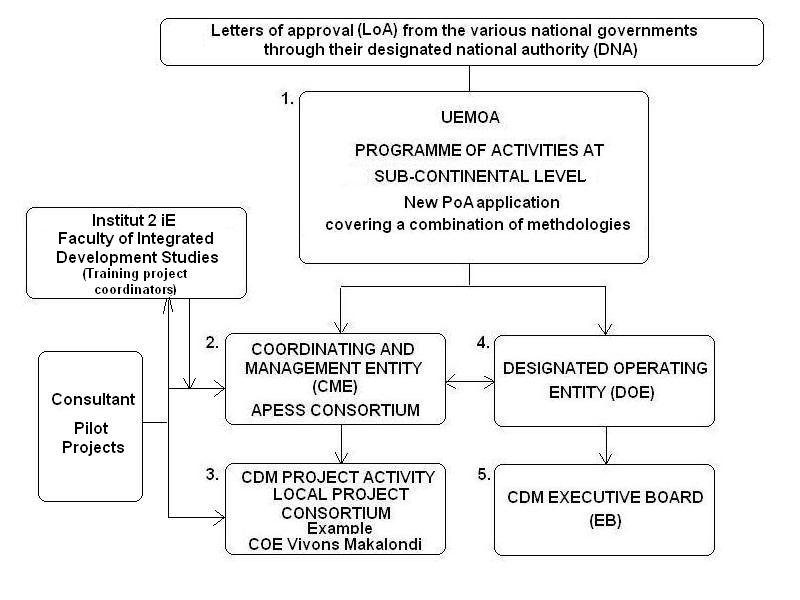
Click here to see how this might work on a sub-continental scale in
developing countries. In the
example, a sub-regional authority is the “owner” of the Programme of Activities
which form an integrated part of its
development policy. The programme is run by a consortium of leading NGOs
represented throughout the sub-region. This consortium is responsible for the
operation of the programme and for the sale of CER emission certificates. On
behalf of the project owner it collects CER emission funds and distributes them
to the cooperative responsible for each individual project. Its activities are
controlled and audited by a DOE (Designated Operating Entity) which acts on
behalf of the CDM Executive Board (EB).
02.
Limitations of Clean Development Mechanism (CDM) applications under the
CDM projects are
used to replace
or improve on current energy consumption. If there is no current energy
consumption it cannot be replaced or reduced. This means that industrialised
countries currently using 50 times more energy per inhabitant are offered much
better opportunities under the protocol than least developed countries where
very little energy is used. There is for the time being no practical limit to
the amount of energy savings possible from the introduction of alternative
energy sources in industrialised and even larger emerging countries. In
contrast, the introduction of solar home systems in least developed countries
is covered under the Kyoto Protocol only for the replacement of, for example, a
few kerosene lamps and batteries. This means the entire CDM mechanism is
(deliberately) biased to the advantage of the industrialised countries, though
it is unlikely this will ever be openly admitted.
The use of the
The CDM system is
business- rather than development-oriented. With the exception of sectors 14
and 15, it is not clear how projects for the improvement of the quality of life of the poor in developing countries are intended
to fit into it. The industrial bias built into the 15 nominated sectors speaks
for itself :
01. Energy
industries.
02. Energy
distribution.
03. Energy
demand.
04. Manufacturing
industries.
05. Chemical
industries.
06.
Construction.
07. Transport.
08. Mining/mineral
production.
09. Metal
production.
10. Fugitive
emissions from fuels (solid, oil, and gas).
11. Fugitive
emissions from production and consumption of halocarbons and sulphur
hexafluoride.
12. Solvent use.
13. Waste
handling and disposal.
14. Afforestation
and reforestation.
15. Agriculture.
The CDM system is
also fraud-sensitive :
“[Europol states
that] Carbon credit carousel fraud in
the EU ETS resulted in losses of about 5 billion Euros in 2008-2009 and is
estimated to account for 90% of carbon trading volume in some countries.”
(Silverstein D., A method to finance a global climate
fund with a harmonized carbon tax”,
One theoretical advantage for
projects in the least developed countries
(LDCs) (according to their status on the date of the publication of
the request for issuance) is that LDCs were exempted from the payment of
registration and adaptation fees at the third meeting of the Conference of the
Parties (COP) (2/CMP.3 par. 31) . Many of those countries have not been
involved in CDM projects under the Kyoto Protocol at all. Other compliance and monitoring costs are
still, however, payable.
02.
Approval of projects by the Designated National Authority (DNA).
Each
duly prepared project has to receive a letter of approval from a Designated
National Authority confirming that the project activity contributes to the
sustainable development of the country concerned. The DNA for any given country
can be found at the list of designated national authorities at
the CDM website of the United Nations Framework Convention on
Climate Change. Note that
on 9th November 2010, 130 of the 191 countries that have ratified
the Kyoto Protocol had less than 10 CDM applications. Of these, 50 countries
had 1-9 projects, 53 countries with a DNA office had no applications, and 27
had no DNA office at all.
SECTION 02. POTential areas of application of CDM
mechanisms under the Kyoto Protocol to integrated development projects.
03.
Potential areas of application.
CDM applications under the Kyoto
Protocol are organised by sector and sub-type or purpose. The 15 sectors are
listed in section 1 above. Since integrated development projects involve a wide
range of services and activities, CDM applications can in principle be made
under several sectors and for several purposes, provided doubling-up of
benefits is carefully avoided. CDM applications apply only to the replacement
or improvement of existing
energy use and conservation
measures which increase carbon sinks. The known long-standing degradation
of forested areas in most developing countries offers prospects for
afforestation and reforestation projects there. These activities may
take place in forests and natural reserves, built-up areas, grass- and
croplands, wetlands, marginal lands, and areas unable to support bio-mass.
These possibilities are included in items 02, 03, 04, 05, 06 and 07 below.
Provided sufficient water is available (integrated development projects to not
cover irrigation projects), afforestation and reforestation activities in a
given integrated development project area may take place in any one or any
combination of the described land-use types.
01. (Small scale)
CO2 savings through the reduced use of biomass for cooking purposes through the
introduction of improved stoves. (Sector 3. Energy demand ?)
02. (Small scale)
afforestation and/or reforestation projects. Recovery of forest lands and
natural parks and reserves using traditional species and/or bamboo and/or other
species. (Sector 14 - Afforestation and reforestation.)
03. (Small scale)
afforestation and/or reforestation projects. Afforestation activities in
settlements as defined Distributed planting
of fruit and nut trees and similar. (Sector 14 - Afforestation and
reforestation.)
04. (Small scale)
afforestation and/or reforestation projects. Small-scale agro-forestry
activities – distributed bamboo plantations, palms, soap-nuts and jatropha on
grasslands and croplands. (Sector 14 - Afforestation and reforestation.)
05. (Small scale)
afforestation and/or reforestation projects. Small-scale agro-forestry
activities – distributed plantations for practical purposes for local use,
including but not limited to bamboo, palms, soap-nuts and jatropha. (Sector 14.
(Small scale) afforestation and reforestation.) on marginal lands.
06. (Small scale)
afforestation and/or reforestation projects on wetlands using traditional
species. (Sector 14 - Afforestation and reforestation.)
07. (Small scale)
afforestation and/or reforestation projects on lands having low inherent
potential to support living biomass. (Sector 14 - Afforestation and
reforestation.)
08. (Small scale)
use of renewable biomass instead of non-renewable biomass with improved cook
stoves. (Sector 1. Energy industries ?)
09. (Small scale)
recycling of human waste to avoid the use of industrial fertilisers. (Sector
13. Waste handling and disposal ?)
10. (Small-scale)
methane recovery from animal waste for cooking and lighting purposes in
pastoralist areas. (Sector 13 – Waste handling and disposal ?)
11. (Small scale)
replacement of kerosene lamps incandescent light bulbs and of the use of
throw-away batteries by renewable energy sources (wind, solar and/or renewable
bio-mass including but not limited to plant oil, gasification of biomass).
(Sector 3. Energy demand ?)
12. (Small-scale)
replacement of non-renewable electrical and diesel-driven sources for
mechanical equipment such as pumps and mills and, where applicable, pubic
lighting systems. (Sector 1- 01. Energy industries ?)
13. (Small scale)
local recycling and recovery of materials from solid wastes, including but not
limited to plastics. (Sector 13. Waste handling and disposal ?)
Different
methodologies are used for different sectors and purposes. Each methodology is
unique to the sector it is listed under. Click here to see which methodologies are linked with which sectors. Since
an activity may fall under any one of several sectors, there may be more than
one methodology which can be applied to it.
Integrated
development projects involve many sectors and purposes. The choice of sector
and of the most suitable methodologies within the sector is complex. In some
cases an application for the approval of a new combination system might turn
out to be the best option as new methodologies can also be submitted to the CDM
Executive Board for approval. The CDM methodologies currently available are
described in the CDM Methodology Booklet
issued by the United Nations Framework Convention on Climate Change (UNFCCC),
SECTION 03. SMALL SCALE CDM ACTIVITIES.
Small-scale CDM
project activities.
Small-scale CDM project activities
are classed in three groups:
I : Renewable project activities with maximum output capacity up to 15
MW or equivalent.
II : Energy efficiency improvements which
reduce energy consumption involving emissions of up to 60 gigawatt hours per year.
III: Other activities reducing
emissions which directly emit less than 60 kilotonnes of CO2, with savings up
to 15 kilotonnes of CO2. Calculation
procedures for group III projects have been simplified.
Individual
small-scale activities under integrated development projects may fall under all
three groups or any combination of them. Common sense would indicate that where
possible they be included under group III where procedures are simplified. The
fact that more small-scale activities so have taken place under groups I and II
than under group III may be linked to the history of the development of the CDM
mechanism and the relatively recent introduction of simplified procedures. For
instance, there is still no specific simplified group III methodology for
bio-mass briquettes ( covered under methodology AMS-I-E below) and the use of
improved stoves (see AMS-II-G), except for methodologies AMS-III-D, AMS-III-F,
and AMS-III-R which are all related to the capture of methane gas.
Type III
small-scale methodologies have been selected in Section 4 below wherever
practicable.
Advantages
of registration as small-scale projects.
The advantages of small-scale
projects are that they :
- Can be bundled (several projects
presented as one) using the form for submission of bundled
small-scale project activities (CDM-SSC-Bundle).
- Use the “simplified” CDM-SSC-PDD (version 03 – 22
December 2006) project design document. A guideline for
the drafting of this document is available.
- Use “simplified” baseline
methodologies.
- New baseline methodologies
can be also submitted following the “simplified” monitoring plans for:
a) the collection
and archiving of data needed to estimate
or measure anthropogenic emissions by sources of greenhouse gases occurring
within the project boundary during the crediting period as specified in
appendix B for the relevant project category;
b) the
determination of the baseline of anthropogenic emissions by sources of
greenhouse gases occurring within the project boundary during the crediting
period, as specified in appendix B for the relevant project category;
c) the
calculation of the reductions of anthropogenic emissions by sources by the
proposed small-scale CDM project activity, and for leakage effects, in
accordance with provisions of appendix B for the relevant project category
(4/CMP.1, Annex II, paragraph 32).
- Use the
same designated operational entity (DOE) for initial validation, and for subsequent
verification and certification. For large-scale projects two different DOEs are
needed.
Despite these advantages, the
complexity of the preparation and management of small-scale CDM projects means
they too are time-consuming and expensive and need well-qualified personnel.
Initial investment costs and on-going compliance costs always need to be
carefully weighed against the potential financial benefits. It may take two
years, or even more, for project approval
and several more years before CER certificates are actually made available for
trading. This means that the high set-up costs have to be paid in advance
without any guarantee the application will be accepted.
SECTION 04. PROGRAMMES OF ACTIVITIES.
Recently
introduced Programmes of Activities (PoA) appear to offer greater potential for
CDM financing of integrated development projects in developing countries. A programme of activities defines parameters
for CDM activities to be included in the programme. It is a sort of convention.
Once registered by the CDM Executive Board, the PoA applies to activities
brought under it from time to time without the need for project by project
applications. For more information refer to : Beaurain F., Schmidt-Traub
G, Developing CDM Programmes of
Activities : A Guidebook, South Pole Carbon Asset Management Ltd,
Zurich, 2010.
Click here to see a drawing
showing how this might work on a sub-continental scale in
developing countries. In the
example, a sub-regional authority is the “owner” of the Programme of Activities
which form an integrated part of its regional development policy. The programme
is run by a consortium of leading NGOs represented throughout the sub-region.
This consortium is responsible for the operation of the programme and for the
sale of CER emission certificates. On behalf of the project owner it collects
CER emission funds and distributes them to the cooperatives responsible for
each individual project. Its activities are controlled and audited by a DOE
(Designated Operating Entity) which acts on behalf of the CDM Executive Board
(EB).
SECTION 05. SELECTION OF THE CDM meTHODLOGIES FOR THE
APPLICATIONS LISTED IN SECTION 2.
01.
CO2 savings through the reduced use of non-renewable biomass for cooking
purposes through the introduction of improved stoves.
CO2 savings
through the reduced use of non-renewable biomass for cooking purposes through
the introduction of improved stoves. ( Application 01 : Sector 3. Energy demand
? Possible
tool indication : Power Consumption, sublevel “Various household
installations”, sub-type “Stoves”, small-scale applications, methodologies AMS-II-G.(Version 2) or
AMS-I-C. Of these, AMS-II-G.(Version 2 ) is
compatible with Sector 3. AMS-I-C is compatible with sector 1 – energy
industries) AMS-I-C refers to electricity generation and may therefore be
excluded. AMS-II-G refers to energy efficient measures in thermal applications
of biomass. So the preferred methodology appears to be AMS-II-G.(Version 2) with
its accompanying “clarification on the
determination of savings in SMS II.G”. This application my be
supplemented by application 08 below. Doubling up with application 08 should be
carefully avoided. A CDM application in
2009 on biomass residues as the fuel
source for individual stoves complete with proposed new base-line and
monitoring methodologies relates to an actual project in
02.
Demonstration projects for the recovery of forest lands and natural parks and
reserves.
(Application 02.
Sector 14 - Afforestation and reforestation.)
The preferred methodology is AR-AMS-0004 , version 2,
11 June, 2009 - Approved
simplified baseline and monitoring methodology for small-scale agroforestry - afforestation and reforestation project activities
under the clean development mechanism. It would be used for forest
recovery (afforestation or reforestation) with preferably with trees natural to
each project area. Bamboo and/or other plantations may also be cultivated. This
methodology is not included in the Tool for Selecting CDM Methodologies and Technologies.
The prescribed
parameters are:
“(a) Project activities are not
implemented on grasslands;
“(b) Project activities lead to
establishment of forest (according to area, height and crown cover thresholds
reported to the EB by the host Party) and allow for continuation or
introduction of a cropping regime;
“(c) The pre-project crown cover of
trees within the project boundary is less than 20% of the threshold for crown
cover reported to the EB by the host Party;
“(d) If there is a decrease in the
area cultivated with crops attributable to implementation of the project
activity then the decrease is not more than 20% of the total area cultivated
with crops at the start of the project.”
The applicability of Reducing Emissions from Deforestation
and Degradation in Developing Countries (REDD) projects is still under
discussion. Lists of projects REDD submitted can be found at the Climate, Community and
Biodiversity Alliance (CBBA) website and at the Forest Carbon Portal website. Because of the uncertainty still surrounding
REDD projects at this time, their use has not been explored further for use
within the framework of integrated development projects.
03.
Afforestation activities in settlements as defined Distributed planting of fruit and nut trees
and similar.
Afforestation
in settlements as defined in 2006 IPCC Guidelines for National Greenhouse Gas Inventories,
and Good Practice Guidance for Land Use, Land-Use Change and Forestry (IPCC
2003), may include all developed land i.e., residential, transportation,
commercial, and production (commercial, manufacturing)infrastructure of any
size, unless it is already included under other land-use categories. The
small-scale methodology AR-AMS-2 (version 2, 17 October 2008) falls
under sector 14 “Afforestation and reforestation” but is not included in
the Tool for Selecting CDM
Methodologies and Technologies.
The prescribed parameters are:
04.
Small-scale agro-forestry activities – such as distributed bamboo plantations,
palms, soap-nuts and jatropha on grasslands and croplands.
Afforestation
and/or reforestation projects. Small-scale agro-forestry activities including
but not limited to distributed bamboo, palm, soap-nut, and jatropha plantations
on grasslands and croplands. (Sector 14 - Afforestation and reforestation.
Methodology AR-AMS-0001
“Simplified baseline and monitoring methodologies for small-scale
A/R CDM project activities implemented on grasslands or croplands with limited
displacement of pre-project activities.” Possible tool indication :
(Sector 14 – Afforestation and
Reforestation - sublevel forests - sub-type either afforestation or
reforestation.
The applicable
parameters are :
“(a)
Project activities are implemented on grasslands or croplands;
“(b)
Project activities are implemented on lands where the area of the cropland
within the project boundary displaced due to the project activity is less than
50 per cent of the total project area;
“(c)
Project activities are implemented on lands where the number of displaced
grazing animals is less than 50 per cent of the average grazing capacity of the
project area;
“(d)
Project activities are implemented on lands where ≤ 10% of the total
surface project area is disturbed as result of soil preparation for planting.”
05
Small-scale agro-forestry activities – distributed demonstration plantations
for practical purposes for local use, including but not limited to Moringa
plantations on marginal lands.
Afforestation
and/or reforestation (AR) projects. Small-scale agro-forestry activities on
marginal lands – distributed plantations for practical purposes for local use,
including but not limited to bamboo, palms, soap-nuts and jatropha. (Sector 14
- Afforestation and reforestation. (AR)). The preferred methodology is AR-AMS-0004 , version 2,
11 June, 2009 – which is intended for forest recovery (afforestation
or reforestation) including but not limited to traditional trees and/or
bamboo This methodology is not included
in the Tool for Selecting CDM
Methodologies and Technologies.
The prescribed
parameters are:
“(a) Project activities are not
implemented on grasslands;
“(b) Project activities lead to
establishment of forest (according to area, height and crown cover thresholds
reported to the EB by the host Party) and allow for continuation or
introduction of a cropping regime;
“(c) The pre-project crown cover of
trees within the project boundary is less than 20% of the threshold for crown
cover reported to the EB by the host Party;
“(d) If there is a decrease in the
area cultivated with crops attributable to implementation of the project activity
then the decrease is not more than 20% of the total area cultivated with crops
at the start of the project.”
06.
Demonstration afforestation and/or reforestation (AR) projects on wetlands
using traditional species.
Afforestation and/or
reforestation (AR) projects on wetlands. (Sector 14 - Afforestation and
reforestation.) AR-AMS-003, Version 1, 14 December 2007. Simplified baseline and
monitoring methodology for small scale CDM afforestation and reforestation
project activities implemented on wetlands. Possible tool indication : (Sector
14 – Afforestation and
Reforestation-sublevel forests, sub-type mangroves. Applications will apply to
mangroves in mangrove swamps. Other traditional species will be used according
to the bio-spheres involves.
07 Demonstration afforestation and/or
reforestation (AR) projects on lands having low inherent potential to support
living biomass.
Afforestation
and/or reforestation (AR) projects on lands having low inherent potential to
support living biomass. (Sector 14 - Afforestation and reforestation). AR-AMS-0005 (Version 2, 8
April 2009) falls under sector 14 “Afforestation and/or
reforestation” but is not included in the Tool for Selecting CDM
Methodologies and Technologies. This methodology can be used as
foreseen in applications 4, 5, 6, and 7 where project activities are
implemented on areas having low inherent potential to support living biomass
without human intervention.
The project
activities shall be implemented on areas listed in (i) to (iv) below. The project
participants (PPs) shall provide evidence/data to support that the selected
project sites meet the local/national criteria for these categories using
information from verifiable sources and/or expert opinion as appropriate:
(iii) Contaminated or mine spoils lands;
(iv) Highly alkaline or saline soils.
08.
Use of renewable biomass instead of non-renewable biomass with improved cook
stoves.
Use of renewable
biomass instead of non-renewable biomass with improved cook stoves.
(Application 3. Sector 1. Energy industries? Possible tool indication :
“Waste”, sublevel “Biomass”, sub-type “Biomass briquettes”, small-scale
applications, methodologies AMS-I-C or AMS-III-B.) The more common application
of the two methodologies is AMS-I-C. Both methodologies are compatible with
Sector 1). AMS-I-C refers to thermal energy using renewable energy sources
instead of fossil based ones. AMS-III-B refers to switching of fossil fuels.
Neither of these appears applicable to integrated development projects.
Methodology AMS-I-E (which falls under the sub-type “manure”) refers to a switch
from non-renewable biomass to renewable biomass for thermal applications by the
user. Integrated development projects provide for the local production of
mini-briquettes made from renewable biomass wastes and residues supplemented as
necessary by purpose-grown renewable crops, rather than to manure. So the most
appropriate technology appears to be Sector 1. Energy industries ? Possible tool indication :
“Renewable Energy”, sublevel “Biomass”, sub-type “Manure”, small-scale
applications, methodology AMS-I-E, using renewable bio-mass instead of manure.
This application supplements application
01 above. Assuming 65% of non-renewable biomass is saved under application 1
above, the remaining 35% of biomass incorporated in the locally produced
mini-briquettes under application 08 must be renewable and it must be proved
that the remaining 35% of biomass being substituted by the mini-briquettes is
non-renewable.
09.
Recycling of human waste to avoid the use of industrial fertilisers.
(Application 09. Sector
13. Waste handling and disposal ? Possible tool indication :
“Waste”, sublevel “Liquid waste”, sub-type “Waste water”, small-scale
applications, methodologies AMS-III-I, or
AMS-III-H, or AMS-III-F, or AMS
III-D, or AMS-I-F, or AMS-I-D, or AMS-I-C, or AMS-I-A. Of these the most common
applications in descending order are AMS-III-H, AMS-I-D, and AMS-I-C.
Methodologies AMS-I-A, AMS-I-C, AMS-I-D and AMS-I-F are all compatible with
sector 1, energy industries). Methodology AMS-III-D is compatible with Sector
15 (Agriculture). Methodologies AMS-III-I, AMS-III-H, and AMS-III-F are all
compatible with sector 13 - waste handling. Of these, AMS-III-I refers to
substitution of anaerobic systems with aerobic ones. AMS-III-H refers to
methane recovery in wastewater treatment. Application 09 does not refer to
methane recovery (AMS-III-H), nor does it refer to the “substitution of an
anaerobic system”. AMS-III-F on the other hand refers to controlled biological
treatment of organic matter by aerobic composting of the biomass and proper
soil application of the compost. The faecal component of human waste is
composted aerobically then applied as proper soil as provided in AMS-III-F. The
urine component of human waste is mixed with grey water to form liquid fertiliser
comprising 1 part of urine to 10 parts of grey water and applied directly for
food production purposes. Imported industrial fertiliser is thereby substituted
by locally produced liquid fertiliser, which would otherwise have been wasted.
The Tool for Selecting CDM Methodologies and Technologies therefore
appears to indicate AMS-III-F as the best solution. However, AMS-III-Y seems to be more appropriate. Although the
second version of methodology AMS-III-Y dates back to 30th October
2009, it has not been included in the Tool for Selecting CDM
Methodologies and Technologies.
Without referring
to methodology AMS-III-F, the CDM Methodology Booklet actually
provides a guideline in its description of AMS-III-Y as
follows :
“1. This methodology comprises technologies and measures that avoid or
reduce methane production from anaerobic wastewater treatment systems and
anaerobic manure management systems, through removal of (volatile) solids from
the wastewater or manure slurry stream. The separated solids shall be further
treated, used or disposed in a manner resulting in lower methane emissions.
“2. The project activity does not recover and combust biogas i.e., the
baseline wastewater or manure treatment plant as well as the project system are
not equipped with methane recovery. Project activities which recover and
combust biogas from manure management systems shall consider AMS-III.D or
AMS-III.R. Project activities which recover and combust biogas from wastewater
treatment systems shall consider AMS-III.H. Project activities that substitute
anaerobic wastewater treatment systems with aerobic wastewater treatment system
shall consider AMS-III.I.
“3. The technology for solids separation shall be one of the below or a
combination thereof so as to achieve a minimum dry matter content of separated
solids larger than 20%:
(a) A pre-separation phase of chemical treatment by mixing flocculants
with the wastewater, adopted to improve the efficiency of the subsequent
mechanical solid liquid separation process;
(b) Mechanical solid/liquid separation technologies (e.g., stationary,
vibrating or rotating screens, centrifuges, hydrocyclones, press
systems/screws), operated inline with the inflowing freshly generated
wastewater or slurry manure stream so as to avoid stagnation;
(c) Thermal treatment technologies that evaporate water content from
the waste stream, either releasing vapour to the atmosphere or condensing it
into a liquid fraction (condensate) containing negligible volatile solids or
COD load, resulting in a solid fraction. Examples include evaporation and spray
drying technologies.”
The technical solution applied in integrated development projects is b)
mechanical solid/liquid separation through the use of urine diversion in
toilets.
10. Methane
recovery from animal waste for cooking and lighting purposes especially in
pastoralist areas.
Small-scale methane recovery from animal waste for
lighting purposes and electricity generation in pastoralist areas. The
resultant energy from this application can also be used for cooking purposes
under : Sector 3. Energy demand ? Possible tool indication : Power Consumption,
sublevel “Various household installations”, sub-type “Stoves”, small-scale
applications, methodology AMS-II-G as
provided in application 01 above. Doubling-up will cause loss of income to
project beneficiaries.
Common sense therefore suggests that energy from
the application be used for lighting purposes and/or for small scale
electricity generation. If it is used for lighting purposes, it can be brought
under (Sector 1 - Energy industries ? Possible
tool indication : Power Consumption, sublevel “Various household
installations”, sub-type “Lighting”, small-scale applications, methodologies
AMS-II-J or AMS-II-C or AMS-I-A or the new methodology AMS-III-AR). AMS-II-C
refers to adoption of energy-efficient appliances. AMS-II-J applies
specifically to the adoption of compact fluorescent lamps. AMS-I-A refers to
small-scale stand-alone or mini-grid electricity generation by the user with
installed capacity up to 15MW with emissions reductions per renewable energy
based lighting system is less than 5 tonnes of CO2 equivalent a year and where
it can be shown that fossil fuel would have been used in the absence of the
project activity.
A better option is : Possible tool indication :
Rewnewable Energy, sublevel “Biomass”, sub-type “Domestic Manure”,
small-scale application AMS-III-R, methane
recovery in agricultural activities at household/small farm level. This must be used in combination with AMS-I-C Thermal energy
production with or without electricity.
The
technology/measure for methodology AMS-III-R comprises :
1. This project category comprises recovery and
destruction of methane from manure and wastes from agricultural activities that
would be decaying anaerobically emitting methane to the atmosphere in the
absence of the project activity. Methane emissions are prevented by:
(a) Installing methane recovery and combustion system
to an existing source of methane emissions, or
(b) Changing the management practice of a biogenic
waste or raw material in order to achieve the controlled anaerobic digestion
equipped with methane recovery and combustion system.
2. The category is limited to measures at
individual households or small farms (e.g. installation of a domestic biogas
digester). Methane recovery systems that achieve an annual emission reduction
of less than or equal to 5 tonnes of CO2e per system are included in this category.
Systems with annual emission reduction higher than 5 tonnes of CO2e are
eligible under AMS III.D.
3. This project category is only applicable in
combination with AMS I.C.
4. The project activity shall satisfy the following
conditions:
(a) The sludge must be handled aerobically. In case
of soil application of the final sludge the proper conditions and procedures
that ensure that there are no methane emissions must be ensured.
(b) Measures shall be used (e.g. combusted or burnt
in a biogas burner for cooking needs) to ensure that all the methane collected
by the recovery system is destroyed.
5. Aggregated annual emission reductions of all
systems included shall be less than or equal to 60 kt CO2 equivalent.
Methodology
AMS-I-C in turn “comprises renewable energy technologies that supply
users with thermal energy that displaces fossil fuel use. These units include
technologies such as solar thermal water heaters and dryers, solar cookers,
energy derived from renewable biomass and other technologies that provide
thermal energy that displaces fossil fuel.”
The new methodology AMS-III-AR (introduced
26th November, 2010) applies
to the adoption of LED lamps. It refers to the lighting technology itself, and
would be included under application 11 below. AMS-III-R
can be used with AMS-I-C for the
rest of the methane produced in application 11 to substitute other existing
electricity/power generation activities. The challenge is to find alternative
existing uses of non-renewable energy within each integrated development area.
Beneficiaries may also choose to use the
gas for new energy uses, but this would not qualify for CDM funding. They may
prefer to use their methane gas to replace the mini-briquettes for stoves under
application 01 above. This too would, however, lead to a drainage of possible
CDM resources.
Calculations under AMS-III-R
with AMS-I-C refer to
displaced fossil fuel equivalents. The CDM system does not provide credits for
methane savings, although methane has 21 times the value of CO2.
11.
Replacement of kerosene lamps, incandescent light bulbs, and of the use of
throw-away batteries by renewable energy sources (wind, solar and/or renewable
bio-mass including but not limited to plant oil, gasification of biomass).
Replacement of kerosene lamps and of the use of
throw-away batteries by renewable energy sources (wind, solar and/or renewable
bio-mass including but not limited to plant oil, gasification of biomass).
(Sector 3 - Energy demand ? Possible tool indication : Power Consumption, sublevel “Various household installations”,
sub-type “Lighting”, small-scale applications, methodologies AMS-II-J or
AMS-II-C or AMS-I-A. AMS-I-A is compatible with sector 1 (energy industries).
AMS-I-A refers to small-scale stand-alone or mini-grid electricity generation
by the user with installed capacity up to 15MW with emissions reductions per
renewable energy based lighting system is less than 5 tonnes of CO2 equivalent
a year and where it can be shown that fossil fuel would have been used in the
absence of the project activity. Methodologies AMS-II-C and AMS-II-J both
conform to Sector 3. AMS-II-C refers to adoption of energy-efficient
appliances. AMS-II-J applies specifically to the adoption of compact
fluorescent lamps. However it is a new methodology, AMS-III-AR (introduced 26th November, 2010, which applies to the adoption
of LED lamps, which appears to offer the best solution. It is not included in
the Tool for Selecting CDM Methodologies and Technologies. Methodologies
AMS-II-C, AMS-II-J, and AMS-III-AR are
all coupled to energy savings inherent in the introduction of lighting
technology, not to the source of energy.
The highest energy savings with the greatest flexibility of use are given by
the adoption of LED lights, so AMS-III-R
appears to be the preferred methodology. The substantially higher
initial investment cost of the lamps is directly recovered by the reduction in
the size of the alternative energy power source installed.
12.
Replacement of non-renewable electrical and diesel-driven sources for
mechanical equipment such as pumps and mills and, where applicable, pubic
lighting systems.
Replacement of
non-renewable electrical and diesel-driven sources for mechanical equipment
such as pumps and mills and, where applicable, pubic lighting systems. (Sector
1, Energy industries ? Possible tool indication : “Renewable
Energy”, sublevel “Solar”, subtype “Solar PV”, small-scale applications,
AMS-I-D or AMS-I-A; or sublevel “Wind”, subtype “Wind”, small-scale
applications, AMS-I-F, or AMS-I-D or AMS-I-A. All three methodologies are compatible with
Sector 1). By far the most common methodology
of the three, AMS-I-D, applies only to alternative energy supply to a
regional or national grid and is therefore not usually applicable in integrated
development projects. AMS-I-F refers to substitution of electricity from a
national or regional grid, from a fossil-fuelled captive power plant or from a
carbon intensive mini-grid. AMS-I-A refers to small-scale stand-alone or
mini-grid electricity generation by the user.
Methodology AMS-I-A is described in the CDM Methodology Booklet as follows :
“This category comprises renewable
electricity generation units that supply individual households/users or groups
of households/users included in the project boundary. The applicability is
limited to individual households and users that do not have a grid connection
except when;
“(a) A group of households or users
are supplied electricity through a standalone minigrid powered by renewable
energy generation unit(s) where the capacity of the generating units does not
exceed 15 MW (i.e., the sum of installed capacities of all renewable energy
generators connected to the mini-grid is less than 15 MW) e.g., a community
based stand-alone off-the-grid renewable electricity systems; or
“(b) The emissions reduction per
renewable energy based lighting system is less than 5 tonnes of CO2e a year and
where it can be shown that fossil fuel would have been used in the absence of
the project activity by;
(i) A representative sample survey
(90% confidence interval, ±10% error margin) of target households; or
(ii) Official statistics from the
host country government agencies.
“The renewable energy generation
units include technologies such as solar, hydro, wind, biomass gasification and
other technologies that produce electricity all of which is used
on-site/locally by the user, e.g., solar home systems, wind battery chargers .
The renewable generating units may be new installations (
Since AMS-I-A has
already been used for applications relating to both wind and solar energy and
to biomass applications for electricity generation including but not limited to
palm oil and manures, this appears to be the most flexible methodology for
application 12.
13.
Local recycling and recovery of materials from solid wastes, including but not
limited to plastics.
Small scale local
recycling and recovery of materials from solid wastes, including but not
limited to plastics, is a feature of integrated development projects. Recovery
and recycling of plastics materials is covered under methodology AMS-III-AJ. This
methodology is not included in the Tool for Selecting CDM
Methodologies and Technologies. It comprises activities for recovery
and recycling of high density polyethylene (HDPE) and low density
polyethylene(LDPE) materials in municipal solid wastes to process them into
intermediate or finished products e.g., plastic resin to displace production of
virgin HDPE and LDPE materials in dedicated facilities thereby resulting energy
savings and emission reduction. Mechanical Recycling: Physical/mechanical
processes are defined as those by which recyclable materials e.g., HDPE and
LDPE plastics are obtained from municipal solid waste by way of separation,
cleaning and compaction/packing for further processing in order to produce
intermediate/finished products to substitute virgin raw materials in an
industrial production chain. The process may be accomplished manually and/or
using mechanical equipment including but not limited to one or more of the
following measures: washing of the separated LDPE and HDPE materials with hot
water, drying, compaction, shredding and pelletizing. Recycling facility is
(are) facility (ies) where the recyclables in the municipal solid waste
collected are sorted, classified and prepared into marketable commodities for
processing/manufacturing in single or multiple locations. The term Processing/Manufacturing facility includes industrial
processes to transform recyclable materials obtained from recycling facility
into intermediate or finished products e.g., plastic resin.
Methodology AMS-III-X relates
to the recovery of HFCs (hydrofluorocarbons) from the recycling of
refrigerators. Until now, AMS-III-AJ is the
only other methodology covering energy savings through the recycling of
non-organic solid waste products.
SECTION 06.
INFORMATION SPECIFIC TO
AFFORESTATION AND REFORESTATION (AR) METHODOLOGIES SPECIFICALLY
APPLICABLE TO INTEGRATED DEVELOPMENT PROJECTS.
A good up-to-date
reference to Afforestation and Reforestation (AR) projects is Building Forest Carbon
Projects : A Step-by-Step Guide, by J.Olander and J.Ebeling,
published by Forest-Trends and the Katoomba Group,
December 2010. This work includes specific aspect by aspect information boxes
with references to the leading resources on the aspect in question.
Key factors which
should always be borne in mind are that project areas must be under the control
of the project proponent(s) and that a given dimension of at least 10.000 to
20.000 tonnes of CO2 per year is needed
to offset the high costs of project preparation, validation, and monitoring.
Pre-implementation costs can be € 100.000-250.000 and more; preparation of a
methodology for € 20.000-75.000 and
more; each periodic verification event between € 15.000-40.000 and more. Most of these funds
are absorbed by nominated Designated Operational Entites (DOEs) (auditors) and
large international (especially financial) institutions which in practice hold
a virtual licence to complicate or facilitate procedures. Project proponents
are placed at their mercy. If the issuing organ
(in the case of Clean Development Mechanism (CDM) projects, the
Executive Board) makes an arbitrary decision either with regard to registration
or to issuance of certificates, project proponents have no remedy. In December 2010 there was still no CDM
appellate body to handle appeals against
the decisions of the CDM Executive Board. A preliminary discussion on this
issue took place during the UNFCCC meeting in Cancun (
Any meaningful
afforestation or reforestation (AR) project is a vast, long-term undertaking.
It requires on-going local (sustainable) water supply and the provision of
locally produced (sustainable) fertilisers. The amount of work needed to
implement projects is mind-boggling.
Integrated development
projects have multiple inherent possibilities for long-term implementation of
afforestation and reforestation (AR) projects. Water and fertiliser supply, and
even labour forces, may be too restricted to enable cotemporaneous
implementation of all of the available possibilities. In those cases,
integrated development project coordinators will need to make painful choices.
Where necessary CDM financing of projects may have to be sacrificed to the
overriding energy-neutral , fully sustainable, ecological principles guiding
integrated development projects.
The proposed
afforestation and reforestation (AR) projects are small-scale. Most of them may
therefore be seen as demonstration projects subject to repetition in each
integrated development project area as manpower and water become available for
the purpose.
02.
Reducing Emissions from Deforestation and Degradation in Developing Countries
(REDD) projects.
REDD projects tend to be more socially based than
CDM projects. They are supposed to avoid deforestation and/or degradation of
existing forests, benefit local communities and promote bio-diversity.
The applicability of REDD projects is still under
discussion. A list of REDD projects submitted can be found at the Climate, Community and
Biodiversity Alliance (CBBA) website. Of the +/- 60 projects listed
there, about 30 have been approved.
Complete documentations for all projects can be accessed at the site.
Some 14 Designated Operational Entities (DOEs) or auditors have been approved
to date. Submitted projects include 18 projects from Central and South America,
Asia (11), East Africa (10),
Full
information on REDD can be found at the REDD Web Platform operated
by the United Nations Framework Convention on Climate Change (UNFCCC). Because
of the uncertainty still surrounding REDD projects at this time, they have not
been used here for applications for integrated development projects.
03. Some
definitions.
Each host country must have adopted its own threshhold parameters for forest coverage.
If it has not done so, and some countries have not, it is not possible to apply
for CDM funding for an AR project there.
Some important definitions (source : Decision -/CMP.1 Land use,
land-use change and forestry ) for afforestation and reforestation
(AR) projects are:
(a) “
(b) “Afforestation” is
the direct human-induced conversion of land that has not been forested for a
period of at least 50 years to forested land through planting, seeding and/or
the human-induced promotion of natural seed sources
(c) “Reforestation” is
the direct human-induced conversion of non-forested land to forested land
through planting, seeding and/or the human-induced promotion of natural seed
sources, on land that was forested but that has been converted to non-forested
land. For the first commitment period, reforestation activities will be limited
to reforestation occurring on those lands that did not contain forest on 31
December 1989
For the CDM
mechanism, land degradation is defined as a long-term decline in ecosystem
function and productivity and measured in terms of net primary productivity.
All forms of land degradation will ultimately lead to a reduction of soil
fertility and productivity. The general effect is reduced plant growth, which
in turn causes loss of protective soil cover and increased vulnerability of soil
and vegetation to further degradation (e.g. erosion).
04.
The importance of afforestation and reforestation (AR) in integrated
development.
Afforestion and
reforestation (AR) activities are potentially very interesting for integrated
development projects. Many developing countries have vast areas of marginal
lands. The level of on-going degradation of existing woodlands is appalling
nearly everywhere. The main cause of this is the ruthless exploitation (theft)
of the existing timber resources of developing countries for the benefit of
large private commercial industrial interests. (See Block 1 of , Section 1 of
the course : 08. In depth : Financial leakage : theft of
resources. )
A second cause is degradation through non-sustainable use of woodlands for cooking fuel and charcoal
production.
Greenhouse gas
emissions calculations for afforestation and reforestation (AR) projects are
particularly complex. Some of these projects have been highly criticised in
international circles. (Silverstein D., A method to finance a global
climate fund with a harmonized carbon tax”,
Biomass
default tables are given in annex 3A.1 of the Good Practice Guidance for
Land Use, Land-use Change and Forestry, published by the Institute for Global Environmental Strategies (IGES) for the
Intergovernmental Panel on Climate Change (IPCC), Kamiyamaguchi, 2003.
05.
Risks.
Long-term and
permanent certified emission reductions (ICER) and (CER) for afforestation and
reforestation (AR) projects are more vulnerable than those for other CDM
sectors. Natural disasters such as fire or floods may wipe out many years of
investment in a few hours. Where this happens, CDM funds received during the
build-up of the carbon sinks have to be repaid, because the carbon sinks have
been lost. This risk is in principle insurable, but the cost of insurance is
very high and represents financial leakage from the integrated development area
where the AR project is situated. Regional level project owners ( for instance
UEMOA in
Flowering of
bamboo plants should be avoided. Like other grasses, flowering may lead to the
end of the life cycle of some bamboo species and may lead to death of the plant
and loss of the sequestered carbon. However the average flowering interval of bamboo is in the region of 30 years.
Grazing in
plantations is another risk.
Lack of water
supply and labour. There is no point starting an afforestation or reforestation
(AR) project without adequate water and labour. Proposed projects listed may
compete with each other in both areas. Where work- and water-supply loads are
excessive, choices need to be made. Traditional farming work In developing
countries is often carried out during rainy seasons. Trees in afforestation and
reforestation projects (AR) need less attention during that period. Work load
is instead intensified during the dry seasons.
06.
Contract forms for forest carbon purchases.
Refer
to Hawkins
S. et al, Contracting for Forest Carbon : Elements of a Model
Forest Carbon Purchase Agreemeent,
published
by Forest-Trends and the Katoomba Group, December 2010.
SECTION 07. NOTES SPECIFIC TO THE ROLE
OF BAMBOO IN AFFORESTATION AND REFORESTATION PROJECTS.
Introduction.
The use of bamboo
for afforestation and reforestation projects within the framework of integrated
development projects is important in the exploitation of CDM financing under
the
For information
on the potential of bamboo for
The annual
productivity of bamboo varies from 5 to 12 tonnes of biomass per hectare with
some 2000-10000 shoots or culms. This corresponds to 9 to 22 tonnes of CO2.
Small scale projects cover up to 15000 tonnes of CO2 per year, involving a
minimum of
Income for each
project area is dedicated to the repayment of
the initial costs of the integrated development project in question. After project repayment, ongoing
income is distributed equally amongst the local populations, who are all
automatically members of the Local Cooperative
for the on-going management and maintenance of the project structures. Since the bamboo projects generate CDM income over the
short term, these CDM funds will be
amongst to be dedicated to re-imbursement of the formal money costs of each
integrated development project.
Assuming the
execution of up to 2500 integrated development projects for West Africa
(excluding Nigeria and Ghana) the scheme would produce at least Euro
5.000.000.000 and up to Euro 9.152.500.000. General application of the concepts
in
Bamboo
cultivation : water requirements.
A disadvantage of bamboo cultivation is
that it needs a good supply of water, which is not always available in
developing countries, especially in arid and semi-arid areas.
For ecological
reasons, integrated development projects do not provide for industrial-level or
extensive irrigation schemes. This means that available rainwater in
water-scarce areas might need to be supplemented by labour-intensive hand-fed
drip irrigation, possibly through the recycling of urine and grey water from
households.
For more
information on water requirements of bamboo crops and their yearly distribution
see Aspects of Bamboo Agronomy, Kleinhenz B. and Midmore J., Academic Press,
Minimum
annual rainfall requirements for bamboo are indicated at
Typical planting
densities are 1000-2500 plants per hectare (monopodial species) and 150-300 clumps per hectare (pachymorph
species). Bamboo plants respond well to the application of all types of organic
manures. Charcoal from bamboo itself fixes carbon in the soil and retains water
and soil nutrients.
For details on
the organisation of bamboo plantations under the CDM system, refer to 04.
Small-scale agro-forestry activities – such as distributed bamboo plantations,
palms, soap-nuts and jatropha on grasslands and croplands in SECTION 08. CDM FUNDING INDICATIONS FOR THE SELECTED
METHODOLOGIES below.
The main features of
bamboo.
“Bamboos provide raw
material for about 1500 known commercial products (Scurlock, Dayton et al.
2000). These range from handicrafts, such as woven baskets, to edible bamboo
shoots produced by about 200 species, to high value industrial goods, such as
pulp, paper and textiles, bio-fuels, charcoal, housing, panels, flooring and
furniture (Lobovikov, Paudel et al. 2007) ” [Lobovikov, M., Yiping, L., et al, The poor man’s carbon sink.
Bamboo on climate change and poverty alleviation, cited above,
p.13.] Where they are used to produce
durable goods, large percentages of carbon savings are retained over a long
term in the products. These activities produce wide-spread employment
possibilities. Note, however, that
harvested wood products are still not accepted for carbon accounting under the
Kyoto Protocol, though this issue is under discussion.
Flowering of
bamboo plants should be avoided. Like other grasses, flowering may be the end
of the life cycle of some bamboo species and may lead to death of the plant and
loss of the sequestered carbon. However the average flowering interval of
bamboo is in the region of 30 years.
Bamboo attributes for climate change ” [ from
Lobovikov, M., Yiping, L., et al, The poor man’s carbon sink.
Bamboo on climate change and poverty alleviation, cited above, Table
3, p.28]
|
Attribute |
Advantage |
Disadvantage |
|
|
|
|
|
Short rotation. |
Early returns; flexibility in land
use and high nutrient exports; high frequency of adaptation to climate
change; consequence of losing stand; smaller needed for sustained-yield
operation; fits well into crediting periods and tCER concept; fits capital
intensity; short exposure to risks. |
Lowers potential site-degrading
interventions, e.g. area compaction; no l-CERs. |
|
Continuous yields. |
Continuous economic returns,
employment, labour demand. |
|
|
Uneven-aged management . |
Multitude of products; no
clear-cuts; less soil nutrient losses
and site deterioration; weeding,
herbicide use, establishment-stage risks. |
Difficult access to interior of
sympodial clumps; lower more difficult monitoring; thinning rules. |
|
Persisting rhizomes after culm
harvest. |
Low decline in biomass and carbon
store: easy regeneration. |
May impede intermittent or
subsequent agricultural use. |
|
Plethora of products. |
Very high conversion efficiency,
low conversion losses; flexible
reaction to market fluctuations; continuous economic benefits along supply
chain from cottage industry to large-scale
industrial production. |
|
|
High appeal to consumers. |
High economic returns for bamboo
products from T-shirts to medicines to floor panels. |
|
|
Wood substitute. |
Reduces demand for timber. |
|
|
Establishment vegetatively . |
Cheap, easy, independent of seed
years. |
|
|
Labour intensive. |
Creates employment or self-
employments; sensitive to rising wages at industrial scale capital extensive;
employment for women, youths. |
|
|
Light when air-dry. |
Manual skidding and transport,
animal use, no soil compaction. |
|
|
Possible integration into
agro-forestry schemes.
|
Reduces slash and burn agriculture
and/or deforestation; opportunities for climate change adaptation; synergies
mitigation/adaptation. |
Allelopathy possible. |
|
May species, worldwide
distribution. |
Adaptation to specific sites and
climate change possible; use as introduced species; overlap with CDM countries. |
|
|
Rapid below-ground growth. |
Site reclamation and organic
matter and carbon accumulation. |
Possible invasiveness; slope
failures on dense root mass. |
|
C3 – plant. |
Increases production at higher
CO2 concentrations . |
More sensitive to drought than C4
plants. |
|
Anatomy and physiology. |
Low ash-, silica- and water
content as bio-fuel.
|
Challenging carbon monitoring;
emissions of methane and
NMVOC; cyanide content. |
SECTION 08. CDM FUNDING INDICATIONS FOR THE SELECTED
METHODOLOGIES.
The following indications are
purely indicative and subject to change on detailed calculation under each of
the methodologies applied.
01. CO2 savings
through the reduced use of non-renewable biomass for cooking purposes through
the introduction of improved stoves.
Introduction.
AMS-II-G.(Version
2) with its accompanying “clarification on the determination of savings in SMS
II.G. Energy efficiency measures
in thermal application of non-renewable biomass. Introduction of high-efficient
thermal energy generation units utilizing non-renewable biomass or retrofitting
of existing units (e.g. complete replacement of existing biomass fired cook
stoves or ovens or dryers with more-efficient appliances) reduces use of
non-renewable biomass for combustion. The idea is that renewable biomass
savings cannot reduce greenhouse gas emissions because the re-growing biomass
reabsorbs them. This is the category under which improved cooking stoves in
integrated development projects best fall.
This methodology first introduced in February 2008 was considered very
complex to use. Version 2, introduced in
December 2009, is supposed to be easier to use. Its use would usually be
coupled with a switch from non-renewable biomass to renewable biomass. (See also
AMS-I-E). The methodology has been adopted in just four (unregistered)
small-scale projects without the issue of CER certificates.
For each integrated development project with
50.000 people and 10.000 families, there is a market for 20.000 to 30.000 improved
cooking stoves. According to this methodology, the fraction of the total annual
biomass savings originating from non-renewable resources is determined and
multiplied by the net calorific value of the biomass actually used and the
emission factor of the fossil fuel that would most likely be used in the
project area in the absence of the project activity.
Supposing a saving of
The website of the
Intergovernmental Panel for Climate Change (IPCC)provides a default value for wood of
0,015 TJ [a terajoule = joule + 12 zeros] per tonne of dry mass or 66,67 tonnes
of dry mass per terajoule.
The default
emission factor for kerosene of 71,5 tonnes of CO2 per TJ. Calculations for integrated development
projects have to be expressed in
kerosene equivalent as kerosene is the fossil fuel that would most likely be used
in the absence of wood in the project areas.
Total non-renewable wood currently used in each project area is 36500
tonnes a year.
Assuming savings of 65 % through the use of high efficiency stoves, the
amount of wood saved would be 23725 tonnes of wood.
Using a factor of 0.5 for the
conversion of wood into dry mass 23725
tonnes of wood = 11.862 tonnes of dry mass
11.862 tonnes of dry mass divided by 66,67 tonnes per TJ = 177,92, say,
178 TJ.
The default factor for kerosene is 71,5 tonnes of CO2 per terajoule.
178 TJ of dry mass x kerosene conversion factor of 71,5 tonnes of CO2 per terajoule = 12727 tonnes of CO2.
12727 tonnes of CO2 @ Euro 14 (as at 14 November 2009)
= Euro 178.178 per year.
Conclusion : Euro
The amount of CO2
(12.727 tonnes) is within the limit of 15.000 tonnes of CO2 per year for
small-scale projects.
Income for each project area is dedicated to the repayment of the initial costs of the integrated development project in question. After project repayment, ongoing income is distributed equally amongst the local populations, who are all automatically members of the Local Cooperative for the on-going management and maintenance of the project structures. Poor countries do not pay registration and issuance costs. The amount is, however, subject to the deduction of DOE (designated operational entity ) verification costs. It is assumed these can be reduced to a nominal figure within the framework of a widely applicable general convention of the type foreseen.
Assuming the
execution of up to 2500 integrated development projects for West Africa
(excluding Nigeria and Ghana) the scheme would produce about Euro
4.455.000.000. General application of the concepts in
CDM projects cover CO2 only. Voluntary
credits (so-called VERs) can be obtained for CH4 (methane) and N2O (Nitrous
oxide) through the privately operated Gold Standard label,
which is based in
For more information refer to AMS II.G Small-scale “Efficiency measures in thermal
applications of non-renewable biomass” with its accompanying “clarification on the
determination of savings in SMS II.G”.
Carbon Markets for Improved
Cooking Stoves : A GTZ guide for project operators, Blunck and others
, 3rd revised edition, GTZ-Hera, Eschborn, February 2010, offers a
general introduction to the subject.
CDM projects : A CDM application in 2009 on biomass residues as the fuel
source for individual stoves complete with proposed new base-line and
monitoring methodologies relates to an actual project in
Gold standard projects : Methodology for Improved
Cook-stoves and Kitchen Regimes V.01 by Climate Care for the Gold
Standard Foundation,
A proposed business plan for a CDM cook-stove project under
integrated development projects.
Determining existing cooker user groups.
01. Accurate
identification of the non-renewable part of bio-mass (or of other fuels)
traditionally used for cooking purposes is at the heart of CDM cook-stove
projects. The weight in tons of non-renewable biomass saved by the
introduction of high-efficiency stoves
multiplied by its carbon-dioxide conversion factor to produce a weight in tons
of carbon-dioxide emissions is what determines the number of CER (Carbon
Emission Reduction) units awarded.
03. How much of
each cluster of materials is traditionally used in the project area ? How much does it cost? This is done through a
“kitchen survey” with minimum surveys of 10% of kitchens (families) with a
minimum sample of 100 where there are more than 1000 users in a cluster. In
principle, the more samples the better.
04. It must be
shown which biomass used is not offset by re-growth in the collection
area. What is the fuel collection (e.g. forest, grassland) area? How much of it is regenerated in forests and
on grasslands on an annual basis ?
05. Calculate the
amount of non-renewable
extracted woody
biomass, non-woody
biomass used, and biomass residues used for each source area (e.g.
forest, grassland).
06. Take into
account eventual lower than required use of cooking utensils and fuels. (E.g. Where there is under-nourishment ;
where is food not available; where people cannot afford to pay for fuel).
07. Can use of renewable energy in the project area lead to
increase in the use of non-renewable energy elsewhere? (This is called
“leakage” and has to be taken into account).
Calculate base-line emissions.
01. Decide units of emission :
e.g. stove-year, kitchen-year, meal-year, product-year.
02. Groups or
clusters are formed for each of the energy sources traditionally used in each
project area. Mostly there are four categories : wood collected by hand, wood
bought commercially, charcoal, and kerosene bought commercially. All cluster
groups would then use the same new stove technology distributed only within the
project area and the same mini-briquettes distributed only within the project
area.
03. The control period for each
sample in each cluster should be for at least one week before the installation
of the new stoves with use of the mini-briquettes, and for one week thereafter.
04. Calculate the base line
emissions. These are (the non-renewable fraction of biomass harvested
times the mass of biomass consumed, multiplied by its CO2 emission conversion
factor) plus (the mass of alternative fuel consumed multiplied by its CO2
emission conversion factor). The sum is expressed in tons of CO2.
05. Decide the percentage of
non-renewable bio-mass used in the project area.
06. Compare emissions under the
new stove regime with those under the old one(s). This is the difference in the
efficiency of the old stoves compared with the new ones. This is most commonly done by a water boiling
test.
07. Decide which type of
non-renewable fossil fuel would be used to substitute non-renewable bio-mass if
the improved cook-stoves were not introduced.
08. Choose the preferred
application period. This can be a single period of ten years, or a period of
seven years renewable twice (for a total of 21 years) subject to full review and
analysis by a Design Operational Entity (DOE) after each of the first two
seven-year periods.
Monitoring.
01. The
monitoring of CDM projects is an expensive and complex exercise. It involves
full base-line emission reviews, usually on a two-year basis, and on-going
comparison with the original base line statistics. This is particularly onerous
with small CDM projects where on-going compliance costs have traditionally been
out of proportion with the relatively low value of the carbon credits granted.
03. Since most
production items, including but not limited to improved cooking stoves, tanks,
toilets are made locally under the local money system set up in each project
area, monitoring is easy because it can be carried under the local money system
. For example, the monitoring of a stoves project can be carried out by
coupling the number of stoves actually sold to the number of locally-made
mini-briquettes which serve as fuel for the stoves distributed over any given
period.
02.
Demonstration project for the recovery of forest lands and natural parks and
reserves using traditional species.
Refer to section 06 above for a
general description of the role of afforestation and reforestation in
integrated development projects.
Refer to section 07 above for a
general description on the role of bamboo in afforestation and reforestation
activities.
Each integrated project area has
about 50.000 inhabitants and is divided into about 250 local development units
and about 40 intermediate development units.
Many integrated
development project areas include forest and/or natural reserves, most of which
are in a deplorable condition. Recovery of degraded forests and natural
reserves is not only essential for the protection of ecosystems and
bio-diversity, it also offers a way contribute to the financing of
integrated-development projects in the areas where the degraded forests and
reserves are situated. This is possible where land tenure of forests and
natural reserves is known and stable and the rights-holders are members of the
permanent cooperative for the on-going management and maintenance of project
structures. Work using the preferred
methodology is AR-AMS-0004 , version 2,
11 June, 2009, is carried out by the local populations under the
local money system set up during an early phase of each integrated development
project.
Forests and
reserves will often be concentrated is specific parts of integrated development
project areas. The populations themselves through the social structures they
set up in each area will decide on how the AR-AMS-0004 methodology
for the project area is organised. Where there is just one subject forest area
or natural reserve, they will usually decide to apply the methodology at the
central project level. Where there are several forest areas or natural
reserves, they may decide to operate through the intermediate development level
administrative units.
AR-AMS-0004 operations
are labour intensive. Labour provided under the local money system is well
paid. If the AR-AMS-0004 methodology
is applied at central level, all of the inhabitants of the project area
contribute to the costs of the labour and benefit equally from all CDM income.
In that case, the “right to work” on the AR-AMS-0004 project may need to be fairly distributed
throughout the integrated development project area. The populations themselves
will decide on how to do this. Plant nurseries and some aspects of general
forest maintenance can easily be distributed. On-going irrigation by hand, on
the other hand, may best be left to people living in or near the forest or
reserve.
Since the
intention of the AR-AMS-0004 applications
is to restore forests and reserves to their original condition to encourage
bio-diversity there only species traditional to the area concerned will be
planted there, irrespective of their rate of growth. Integrated development
projects are long-term and free from rapid capital return requirements.
Within the target
mix of species for a given application, long-term preference will be given to
endangered species. In drier areas, short-term preference within the mix of
species will be given to those with deeper roots capable of relatively early
“independence” from manual watering requirements. Once established, these
should provide protection and assist in water husbandry for potentially more
exposed shallow-rooted types.
The biggest single problem to the
application of AR-AMS-0004 and with all other
afforestation and reforestation (AR) initiatives in integrated development
project areas is water rather than labour. Water required
under AR-AMS-0004 applications
is additional to the water used for bamboo-based projects under AR-AMS-0001
described in section 04 below which take first preference because
they provide earlier returns and greater occupational opportunities, with a
possible future potential of allowance for storage of CO2 in worked bamboo
products. AR-AMS-0004
applications also compete for water with projects under AR-AMS-2 in section
03 below and with projects in marginal areas under section 05 and wastelands
under section 07. Integrated development projects allow for rainwater
harvesting but not for large-scale irrigation. Small-scale hand-operated drip
irrigation techniques can be applied where limited amounts of water can be
obtained from shallow hand-dug wells, provided this can be shown to be
sustainable and free from effects on the water table. This means the assistance
offered by early planting of deep-rooted species is of such great
importance.
AR-AMS-0004 contains
default figures for various types of forest. Each application will cover will
be specifically designed to provide carbon sinks for up to 15.000 tonnes
of CO2. Where possible, potential CO2
sinks may be increased (and the maximum benefit capped at maturity) to provide
for higher income during initial slow growth periods. 15.000 tons of CO2 @ abut Euro 14 per tonne {as at 14
November 2009] would produce up to Euro
Each
AR-AMS-0004 application
will be different from one project to the other. The average annual income
should be more or less the same for each one. The area planted and the number
of trees needed to achieve the annual income will vary from case to case. An
average rate of increase of about 3 tonnes of dry matter per hectare per year
produces about 5 tonnes of CO2 sinks. On
that basis, 15.000 tonnes of carbon CO2 sinks would involve a forest area of
Protection of
plantations in early growth phases is a second major problem to be
faced. A plantation area of
Planting can be
staggered over a number of years. Assume it is not. Hand-fed drip irrigation
for 1.200.000 young trees in dry seasons
requires one minute per tree, one person can manage 60 trees an hour or 480
trees per day. Assuming a five-day working week and a cycle of one watering per
week, each person can handle 2400 trees. This means that up to 500 people could
be needed to look after the 1.200.000 young plants in dry seasons during the
early years. Assuming dry seasons last 8 months or 35 weeks, the total number
of hours worked could therefore be 35 weeks x 40 hours per week x 500 people, or 700.000 hours per year over the first six or
seven years. 700.000 hours’ work will involve local money costs amounting to
700.000 hours x 10 local currency units
(this is the average expected working rate under the local money systems), or
7.000.000 local currency units per year. Assuming there are 35.000 adults in the
integrated development project area concerned,
this involves an annual cost to each adult of 200 local currency units,
equal to twenty hours’ work (work for
two and a half days) per adult per year during the critical growing period.
These are the “costs” the local populations need to agree to.
Total
project income could be up to Euro 10.500.000 (expressed in 2010 Euros) or more
per project, less the costs charged by the nominated the Designated Operational
Entity (DOE) . Assuming total
forest husbandry costs to be the equivalent of twelve years’ peak requirements,
total work is 700.000 hours x 12 years, or 8.400.000 hours’ work. This produces
an hourly formal money (Euros) income of about Euro 1.25 per hour, less DOE
costs. In most developing countries today, this would be considered a satisfactory
return on labour.
Income for each project area is dedicated to the
repayment of the initial costs of the
integrated development project in
question. After project repayment, ongoing income is distributed equally
amongst the local populations, who are all automatically members of the Local
Cooperative for the on-going management
and maintenance of the project structures. Poor countries do not pay
registration and issuance costs. It is assumed that DOE (designated operational
entity ) verification costs can be reduced to a nominal figure within the
framework of a widely applicable general convention of the type foreseen.
As mentioned, total project income could be up to Euro
10.500.000 (expressed in 2010 Euros) or more per project. Assuming
the execution of up to 2500 integrated development projects for West Africa
(excluding Nigeria and Ghana) the scheme would produce at least Euro
28.125.000.000. General application of the concepts in
The proposed demonstration
projects can be repeated as and when labour and water supplies become available
in each integrated development project area.
03.
Afforestation activities in settlements as defined for the distributed planting of fruit and nut
trees and similar.
Methodology AR-AMS-2 (version 2, 17 October 2008) allows
for afforestation in settlements. Settlements as defined in 2006 IPCC
Guidelines for National Greenhouse Gas Inventories, and Good Practice Guidance
for Land Use, Land-Use Change and Forestry (IPCC 2003) may include all
developed land i.e., residential, transportation, commercial, and production
(commercial, manufacturing) infrastructure of any size, unless it is already
included under other land-use categories. Work using the preferred
methodology AR-AMS-2 is carried
out by the local populations under the local money system set up during an
early phase of each integrated development project.
In developing
countries settlements are likely to be land strips along roads and streets,
waterways, parks, village squares and other public places. Such areas are often
not specifically zoned in developing countries. They are often in the “public
domain”. The width of the strips can be influenced by each country’s definition of forest, which
can include limitations to the width of plantations. Limitations of this type
are rare. Default values for forests under the CDM are between 0.05–1.0 hectare with tree
crown cover (or equivalent stocking level) of more than 10–30 per cent with
trees with the potential to reach a minimum height of 2–5 metres at maturity in
situ. Country default values must fall within these parameters. Fairly low
country definition values optimise the use of AR-AMS-2 for the planting several rows of fruit trees
and nut trees along paths and roads, in village squares, and around churches,
mosques and other public places. It is therefore wise for national governments
to specify minimum areas in hectares and minimum tree heights at maturity in
their definitions of forests. If a minimum area for a forest is defined as one
hectare (
Not only does
application 03 for fruit trees using AR-AMS-2 provide a
possibility to create carbon sinks, it also greatly increases the food security
of the populations in integrated development project areas. Useful production
of most fruit trees begins quite early, within about 3-5 years and can continue
for 30 years and more. Some species of nut trees may produce for 100 years.
Variations amongst species are enormous, so each individual project needs to be
specifically developed according to the wishes of the local populations.
A disadvantage of
many species of fruit trees is that their growth in wood volume is sometimes
limited to about 20 years, though timber density may continue to consolidate
slowly after that. Regular pruning requirements also reduce annual CO2 storage
increments, as these must be subtracted from the calculations of the CO2 sinks
achieved. These limitations do not usually apply to nut trees.
Each integrated project area has
about 50.000 inhabitants and is divided into about 250 local development units
and about 40 intermediate development units. Operations under AR-AMS-2 would be a bundling of 250
mini-projects one at each local development unit level, together designed to
provide carbon sinks for 15.000 tonnes of CO2 equivalent per annum. This is
roughly 19.000 tons of dry timber mass.
This amounts to an annual
increase of up to 19.000 tonnes/250 local development unit areas or 76 tons of
dry timber for each of the 250 local development units.
It is assumed that each local
development unit area will develop 7-
The biggest single problem to the
application of AR-AMS-2 and with all other
afforestation and reforestation (AR) initiatives in integrated development
project areas is water rather than labour. Water required
under AR-AMS-2 applications
is additional to the water used for bamboo-based projects under AR-AMS-0001
described in section 04 below which take first preference because
they provide earlier returns and greater occupational opportunities, with a
possible future potential of allowance for storage of CO2 in worked bamboo
products. AR-AMS-2 applications also compete for water with
projects under AR-AMS-0004 in
forest areas in section 02 above and with projects in marginal areas.
Integrated development projects allow for rainwater harvesting but not for
large-scale irrigation. Small-scale hand-operated drip irrigation techniques
can be applied where limited amounts of water can be obtained from shallow
hand-dug wells, provided this can be shown to be sustainable and free from
effects on the water table. This means the assistance offered by early planting
of deep-rooted species is of such great importance.
An advantage of
growing trees in settlement areas is that rainwater harvesting off road
surfaces and squares is usually easier to carry out than in forest areas and on
grasslands. The rainwater can sometimes be harvested close to where the trees
are planted. The amount of water which can be sustainably harvested this way is
limited, but it should be enough to extend rainy seasons for a few weeks.
Each local development unit would
decide which trees it wants to plant. Species should be chosen to
provide a wide diversification of fruit and nuts throughout the year, rather
than have a flood of products during a single short season. The food value of
fruit and nuts produced takes priority over CDM income from the plantations.
Traditionally, orchards in many countries were coupled with grazing activities,
with just 200 trees, and even less, per hectare. Modern industrial orchards may
contain anything up to 1500 trees per hectare. This does not conform to the
sustainability requirements of integrated development projects.
It is assumed
here that 50% (about 3.5-
Protection of
plantations in early growth phases is a second major problem to be
faced. Provided equipment can be safely guarded, electric fences operating on
photovoltaic power (PV) may offer an appropriate solution to this problem.
CDM
income for this 50% of settlement area activity is comparable with that for 50%
of forest recovery activities described under 02.
Recovery of forest lands and natural parks and reserves using traditional
species above, with the difference that the nuts can be harvested
for food and stored for longer periods, increasing the food security of the
local populations. Income from this 50%
would be about Euro
CDM income from
the remaining 50% (3.5 -
Notwithstanding
this, carbon sinks for standard orchards are estimated to be about 30 tons of
dry mass per hectare, with an average
annual increment over 20 years of 1.5 tonnes of dry mass. Multiply this by 50%
to reach its estimated carbon content, which is
0.75 tons of carbon per hectare per year x 3.6663, which is the ratio of
the atomic weight of CO2 ( 43,999915 to that of carbon 12,001115 – otherwise
known as the 44/12 ratio). This is about 2,75 tonnes of CO2 per hectare per
year. 2,75 tonnes CO2 x about Euro 14 per tonne (as at 14 November 2009)
amounts to Euro 38,5 per hectare. The
annual amount for each local development unit is therefore Euro 38,5 x minimum
Expected CDM
project income from 03. Afforestation activities in settlements as
defined Distributed planting of fruit
and nut trees and similar is therefore about Euro 5.250.000 for the 50%
planted with nut trees and similar, and Euro 673.750 for the 50% area planted
with fruit trees, for a total of Euro 5.923.750.
Assuming the
execution of up to 2500 integrated development projects for West Africa
(excluding Nigeria and Ghana) the scheme would produce at least Euro
14.809.375.000. General application of the concepts in
One species of possible interest is the butterfruit, or safou,
(dacryodes edulis) which is native to west and central
In humid tropical areas with high rainfall (
In principle, CDM settlements projects are
one-off projects for each integrated development area as settlement areas are
limited.
04. Small-scale agro-forestry
activities – such as distributed bamboo plantations on grasslands and croplands.
For this section,
bamboo plantations are preferred to other possible crops because of the
superior features of bamboo with regard to rapid growth, yield, flexibility of
use, (eventually) food supply, and potential for creating occupations and added
value. In semi-arid and arid areas where water supply is a problem, preference
may be given to mixed or to alternative forest crops.
For technical
information on bamboo plantations refer to SECTION 07. NOTES SPECIFIC TO THE
ROLE OF BAMBOO IN AFFORESTATION AND REFORESTATION PROJECTS above.
Small-scale
agro-forestry activities on grasslands and croplands are covered under Sector
14 - Afforestation and reforestation (AR) by methodology AR-AMS-0001
“Simplified baseline and monitoring methodologies for small-scale
A/R CDM project activities implemented on grasslands or croplands with limited
displacement of pre-project activities.” The project area is the integrated
development project area, and all of the technical parameters for methodology AR-AMS-0001
are automatically met. These are:
“(a)
Project activities are implemented on grasslands or croplands;
“(b)
Project activities are implemented on lands where the area of the cropland
within the project boundary displaced due to the project activity is less than
50 per cent of the total project area;
“(c)
Project activities are implemented on lands where the number of displaced
grazing animals is less than 50 per cent of the average grazing capacity of the
project area;
“(d)
Project activities are implemented on lands where ≤ 10% of the total
surface project area is disturbed as result of soil preparation for
planting.”
Assuming a
minimum area of
Careful analysis is
needed before bamboo is adopted for CDM purposes in arid and semi-arid areas as regular and systematic provision of water and fertiliser by
hand for say 7500 plants in each local development area is no joke. Assuming
hand-fed drip irrigation for 7.500 bamboo plants in dry seasons requires one
minute per plant, one person can manage about 60 plants an hour or 480 plants per
day. Assuming a five-day working week and a cycle of two water treatments a
week, each person can handle 1200 plants. This means that about 6 people could
be needed in each local development area to look after the 7.500 bamboo plants
in dry seasons. Assuming dry seasons last 8 months or 35 weeks, the total
number of hours worked could therefore be 35 weeks x 40 hours per week x 6 people, or
8.400 hours per year on an on-going basis. An advantage is that the work is done during
the dry seasons, when the traditional work load on rural communities is lighter
than during the rainy seasons. Another advantage is that the work can carried
out by anyone, including the blind and some handicapped people.
8.400 hours’ work
per year in each of the 250 local development units will involve local money
costs amounting to 8.400 hours x 10
local currency units (this is the average expected working rate under the local
money systems), or 84.000 local currency units per year in each local
development unit area. Assuming there are 180 adults in that local unit
area, this involves an annual cost to
each adult of about 500 local currency
units, equal to fifty hours’ work (work for about six days) per adult per year.
These are the “costs” the local populations need to agree to. Until harvested
wood products made from bamboo are accepted for carbon accounting, the
harvested bamboo does not add to CO2 sinks and does not qualify for CDM
financing. It is replaced annually. It is therefore renewable biomass, which
can be freely used indefinitely and on an on-going basis for the manufacture of
mini-briquettes for cook stoves and the production of many other items.
The growth cycle
of the bamboo plant is about seven years, after which the CO2 stored in the
plantation is maintained by selective cropping. This means that CDM financing
is paid out on the period of incrementation of CO2 storage, which is 7 years.
After that, the plantation must be properly maintained to avoid the need to
repay the CDM funds received for CO2 storage. In exchange for their labour, local
populations receive a regular supply of edible bamboo shoots (where an edible
variety is planted), an on-going supply of renewable biomass for use in
mini-briquettes for cooking purposes, and materials for numerous labour-intensive
productive activities. The productive activities will be modelled to the
requirements of the integrated development project area as a whole. Commonly
required items will produced and consumed in each local development unit area.
More specialised items will be produced for sale in the intermediate
development unit areas. Highly specialised items such as bamboo bicycles will
be made for distribution and sale at general project level. These are listed in
the article in section 07 above.
An average bamboo plantation of
Formal money
returns of Euro 1,10 per day may seem low. However, the people carrying out the
maintenance of the bamboo forests are fully paid under the local money system
set up in the integrated development project area in question. Each of the 250
local development units in the project area benefits fully from the bamboo it
produces. Assuming an average production of 8 tonnes per hectare,
Assuming the
execution of up to 2500 integrated development projects for West Africa
(excluding Nigeria and Ghana) the scheme would produce a CDM income between
Euro 5.000.000.000 and Euro 9.152.500.000. General application of the concepts
in
Not only Pandas like bamboo. Ruminants eat it too. Bamboo
leaves have been used for animal fodder in
In humid tropical areas with high rainfall (
In principle, CDM bamboo projects are one-off
projects for each integrated development area. Bamboo supply from the one
project should be enough to meet the requirements and processing possibilities
of the local populations.
05
Small-scale agro-forestry activities – distributed demonstration plantations
for practical purposes for local use, including but not limited to Moringa
plantations on marginal lands.
Afforestation
and/or reforestation (AR) projects. Small-scale agro-forestry activities on
marginal lands – distributed plantations for practical purposes for local use,
including but not limited to moringa plants. (Sector 14 - Afforestation and
reforestation (AR).). The preferred methodology is AR-AMS-0004 , version 2, 11
June, 2009 – which is the one used for forestry applications under
point 02. Recovery of forest lands and natural parks and reserves using
traditional species.
As with applications 02-04, the biggest single problem to the application
of AR-AMS-0004 to marginal lands in
integrated development project areas is water rather than labour. Water
required under this application 05 is additional to the water used for
applications 02, 03, and 04. Integrated development projects allow for
rainwater harvesting but not for large-scale irrigation. Small-scale
hand-operated drip irrigation techniques can be applied where limited amounts
of water can be obtained from shallow hand-dug wells, provided this can be
shown to be sustainable and free from effects on the water table. This means
the assistance offered by early planting of deep-rooted species is of great
importance.
It is assumed
that many integrated development project areas will incorporate marginal lands,
especially in pastoral communities. CDM applications in marginal lands have the
advantage that they are not limited to the use of traditional forest species
native to the project area. They may also tend to be more extensive.
One important
species, which is already domesticated (naturalised) in many developing
countries, is the moringa oleifera or horseradish tree. Some basic information
on it can be obtained at the file Moringa sand filters for water
purification. Plenty of supplementary information on it is available
on the internet. The horseradish is a very special tree. It has deep tap roots
which make it suitable for dry areas. It grows very quickly, up to
Because it sinks
its tap-roots quickly, the horseradish tree needs human assistance for watering
for a maximum period of 12 months after transplanting, usually less. It adapts
to water scarcity by reducing the number of leaves. This means that
cultivation-related labour costs are lower than those in applications 01-04
above. Once established it mines fertilisers from the soil. Natural fertilisers
should be used at planting time. Manure from animals in pastoralist areas is
ideal for this purpose.
All parts of the
horseradish tree can be consumed. Its leaves are a substitute for spinach, and
form prized forage for animals, especially goats. Horseradish leaves grow in
the dry season and are available when grasslands are barren. The oil from their
seeds is edible, similar to olive oil, and used for cooking. The seeds
themselves can be eaten like peanuts. The seed cake after pressing can be used
to make Moringa sand filters for water purification.
Its bark can be chewed. All parts of the tree are said to have medicinal
qualities.
The horseradish
tree is widely used as a hedgerow for the alley cultivation of various crops,
which need shelter from wind and excess of sun. As a hedgerow, it interferes
more with the crops grown than other wind/sun protections. Use with
“shade-tolerant leafy vegetables and herbs is best since moringa hedgerows are
highly competitive and can reduce yields of companion plants significantly. For
instance .it can reduce the yields of eggplant and sweet maize by up to 50% (Infonet-biovision.org
website, accessed 31 December 2010.)
The same resource suggests the use of the Moringa plants themselves as
supports for crops such as pole beans, once the Moringa trees are mature. From the second year onwards, Moringa can be
intercropped with maize, sunflower and other field crops. Where climatic
conditions are appropriate, sunflower is particularly recommended s it helps to
control weed growth.
Combination of the use of
horseradish tree as hedgerow with pull-push (“stimulo-deterrent
diversion”) technology for improved maize, sorghum, millet and other crop
yields (The Gatsby Charitable Foundation, The Quiet Revolution :
Push-pull Technology and the African Farmer.
This means that
CDM income is earned during the early cropping years, once the horseradish has
reached its maximum CO2 sink conditions.
Horseradish
produces 3 tons of carbon per hectare per year, with carbon fixation ratio of 3
x 44/12, or 11 tons of CO2 per hectare
per year. At a rate of about Euro 14 per tonne CO2 (14 November, 2009) the
potential CDM income is Euro 154 per hectare per year over 3 years or Euro 462 per hectare over the
three years period. The production of 15000 tons of CO2 allowed under
small-scale CDM methodologies would therefore need about
Assuming the
execution of up to 2500 integrated development projects for West Africa
(excluding Nigeria and Ghana) the scheme would produce a CDM income between
Euro 1.617.000.000. General application of the concepts in
As mentioned, the
area planted with horseradish would be about
Because animals
love Moringa leaves, plantations need to be protected from them. Provided
equipment can be safely guarded, electric fences operating on photovoltaic
power (PV) may offer an appropriate solution to this problem.
Another planting
option (subject to testing) might be the kiri tree (paulownia tomentosa) which is
reputed to be one of the world’s fastest growing trees with one of the highest
amounts of C02 storage. According to a press article in the Concord Times in
“In addition,
field work has been undertaken in
06. Demonstration afforestation and/or
reforestation (AR) projects on wetlands using traditional species.
CDM methodology AR AMS-003, Version 1 , 14 December 2007 would apply to 06. Afforestation and/or reforestation
(AR) projects on wetlands using traditional species. Applications up until now
have been applied to mangroves in mangrove swamps. Other traditional species
will be used according to the bio-spheres involved. Integrated development project areas with
wetlands are by definition unlikely to have areas falling under application 07 Afforestation and/or reforestation (AR)
projects on lands having low inherent potential to support living biomass. The same concept applies the other way round.
Areas unable to support bio-mass are not usually to be found in river deltas,
along coasts, and adjacent to lakes. While methodologies for wetlands and
methodologies for low-biomass areas will usually be alternatives, both can be
applied where the possibilities exist.
Mangrove forests
are under threat world-wide. They are amongst the most important eco-systems
for bio-diversity and for fish-spawning, and as tidal and tsunami barriers.
They are found throughout tropical regions in all continents. Click here for a satellite map showing the
distribution of mangrove swamps. In West Africa, for instance, they
are found along the Atlantic coast from Senegal to Liberia, and along much the
Eastern coast of the Gulf of Guinea and cover
an area of about
One advantage of
wetlands developments is that by definition they do not compete for water with
applications 02-25 and 07.
Wetlands are
considered degraded if one or more of the following conditions are commonly
present within the proposed project boundary and are likely to continue to
occur in absence of the project activity:
1. Vegetation degradation:
• For degraded condition show that, for example:
The cover and/or health of vegetation as determined by visual assessment or
similar indicator-based approach has decreased by at least 25% below that of
similar undisturbed wetlands with similar ecological conditions.
• For degrading condition show that, for example:
The cover and/or health of vegetation as determined by visual assessment or
similar indicator-based approach has decreased by at least 25% occurring over a
reasonable period of time since 31 December 1989 as selected by the project
participants and before the start of the proposed A/R project activity.
2. Anthropogenic influences leading to degradation,
for example:
• There is a documented history of on-going loss of
vegetation cover due to anthropogenic influences; or
• Evidence can be provided that anthropogenic actions,
which are likely to continue in the absence of the small scale A/R project
activity, can be documented as the cause of on-going loss of vegetation cover
on similar lands elsewhere.
3. Provision of any other evidence that
transparently demonstrates project lands are degraded or degrading.
Wetlands
are defined as :
(i) Degraded intertidal wetlands (e.g.
mangroves);
(ii) Undrained peat swamps that are degraded
with respect to vegetation cover;
(iii)
Degraded flood plain areas on inorganic soils and
(iv) Seasonally flooded areas on the
margin of water bodies/reservoirs.
The Good Practice Guidance for
Land Use, Land-use Change and Forestry, published by the Institute for Global Environmental Strategies (IGES) for the
Intergovernmental Panel on Climate Change (IPCC), Kamiyamaguchi, 2003 defines
wetlands as land (excluding rice cultivation areas) that is
covered or saturated by water for all or part of the year and that does not
fall into the forest land, cropland, grassland or settlements categories.
An actual fully documented project example
for a small-scale and low-income
community-based mangrove afforestation project on tidal flats of three small
islands around Batam City,
Carbon storage by mangroves is thought to be
higher than that in tropical forests. It is believed to attain 500 tonnes per
hectare over the 30 year growing cycle.
Assuming an average annual carbon dioxide
storage of 32 tonnes of CO2 per hectare
per year, the CDM small-scale project limit of 15.000 tonnes CO2 per year will
support maximum plantation area of about
32 tonnes of CO2 per hectare at about Euro 14 per tonne (14 November
2009) produces an annual CDM income of
up to Euro
Just how many of
the mangroves in
“At least 40% of the
animal species that are restricted to mangrove habitat and have previously been
assessed under IUCN Categories and Criteria are at elevated risk of extinction
due to extensive habitat loss [12].
It is estimated that 26% of mangrove forests worldwide are degraded due to
over-exploitation for fuelwood and timber production [24].
Similarly, clearing of mangroves for shrimp culture contributes ~38% of global
mangrove loss, with other aquaculture accounting for another 14% [1].
In
Assuming loss of
50% of the mangroves in West Africa, about
Since mangroves are used for fodder for camels, goats
and sheep and other animals, new plantations need to be properly protected.
This aspect needs to be carefully considered when each project is drafted, as
the presence of water may mean the use of electric fences operating on
photovoltaic power (PV) is not possible for this purpose.
The proposed
demonstration projects can be repeated as and when labour and water supplies
become available in each integrated development project area.
For the purposes
of CDM incomes this application has been rated at zero as it will often be an
alternative to applications on dry lands. Since more projects are likely to
involve dry lands than wetlands, standard indicative calculations include CDM
projects for dry lands. Wetlands projects produce a CDM income of about Euro
6.048.000, more than four times that of dry lands projects which produce
only Euro 1.4430.750. Mangroves accumulate carbon sinks over 30
years, Jatropha over just 4-5 years.
07 Demonstration afforestation and/or
reforestation projects on lands having low inherent potential to support living
biomass.
AR-AMS-0005 (Version 2, 8
April 2009) where project activities are implemented on areas having
low inherent potential to support living biomass without human intervention.
Project
activities are implemented on areas listed in (i) to (iv) below. Project
participants have to provide evidence/data showing the selected project sites
meet the local/national criteria for these categories using information from
verifiable sources and/or expert opinion as appropriate:
(iii)
Contaminated or mine spoils lands;
(iv) Highly alkaline or saline soils.
The United Nations Convention to
Combat Desertification was adopted in
“1.
The objective of this Convention is to combat desertification and mitigate the
effects of drought in countries experiencing serious drought and/or
desertification, particularly in Africa, through effective action at all
levels, supported by international cooperation and partnership arrangements, in
the framework of an integrated approach which is consistent with Agenda 21,
with a view to contributing to the achievement of sustainable development in
affected areas.
“2.
Achieving this objective will involve long-term integrated strategies that
focus simultaneously, in affected areas, on improved productivity of land, and
the rehabilitation, conservation and sustainable management of land and water
resources, leading to improved living conditions, in particular at the
community level. ”
Article
7 or the convention gives priority to the situation in Africa, including (under
article 10) the incorporation of “long-term strategies to combat desertification
and mitigate the effects of drought, emphasize implementation and be integrated
with national policies for sustainable development;” and giving “particular
attention to the implementation of preventive measures for lands that are not
yet degraded or which are only slightly degraded; ” “through sustainable
management of natural resources; sustainable agricultural practices;”.
Annex
I of the Convention refers specifically to Regional Implementation in Africa,
article 3 of which refers specifically to
“the widespread poverty prevalent in most affected countries, the large
number of least developed countries among them, and their need for significant
amounts of external assistance, in the form of grants and loans on concessional
terms, to pursue their development objectives; ”
The Economic Community of West
African States (ECOWAS) and CILSS published the sub-regional action programme
against the desertification in West Africa and Tchad, in May 1999.
This document is available in French
only. It provides for extensive cooperation at sub-regional level amongst the
Community members in eight priority sectors, but does not refer to specific
practical actions.
The EU-Africa Infrastructure
Partnership was launched in
“ Combat desertification and improve the
livelihoods of the inhabitants of the countries of the Sahara and Sahel zones
of
The expected outcomes are :
“Progress towards reversal of desert encroachment
and soil degradation; Improvement of
micro-climatic conditions and reduction of land degradation.”
Activities include :
“Identify the
relevant activities in the “Green Wall Initiative”
adapted to the national and regional context; [The Green Wall for the Sahara
Initiative, proposed by the Department of Rural Economy and Agriculture of the
The African Union Commission,
• Enhance environmental sustainability within the
framework of regional and international environmental agreements;
• Advance the implementation of the United Nations Convention to
Combat Desertification;
• Improve the knowledge on land degradation and
desertification;
• Control land degradation, promote sustainable
land management with a view to integrate land management issues in national
development strategies, including poverty reduction strategy papers (PRSPs),
and increase land productivity and food production;
• Promote integrated natural resource management
and conserve biological diversity;
• Address the problems of land degradation and
increasing aridity at all relevant levels to respond to local needs and build
on local and individual efforts and successes;
• Create awareness and promote wider public
involvement in arresting desertification in a sustainable manner;
• Identify and promote alternative livelihoods and
productive systems for the populations affected by desertification.”
The fight against
desertification has been linked with the Jatropha plant (Jatropha curcas). This
plant has a number of features making it interesting for action against
desertification, but its cultivation is controversial because of the claims
made about its suitability for the production of bio-fuels. The plant has been
widely discussed in relation to its “business” potential, where it became a
hype, rather than for its inherent ecological properties. These aspects are
reviewed in Jongenschaap R.E. et al,
Claims and Facts on Jatropha Curcas L., Report 158, Plant Research
International,
Jatropha is
interesting for projects in areas with low potential to support biomass
because, if sown as seed, it produces a thick primary tap root with 4 lateral
roots and straight secondary roots. If it is derived from cuttings, the tap
roots do not develop, and the plant grows only secondary roots. Within the
framework of integrated development projects, all plants would therefore be grown from seed. In that case,
for what its worth, they would start producing seeds (fruit) after two years.
Production of fruit would then continues for up to 50 years and more.
The plant grows
rapidly to reach a height of 4-
Claims concerning
rainfall conditions necessary for the survival of Jatropha vary widely. Some
indications from
The plant is
widely known in some African countries, for example
The press cake
remaining after oil-pressing can be used for fertilisation.
Jatropha wood is
of poor quality even for fire-wood, but it could be used for the production of
mini-briquettes for improved cook stoves.
Jatropha trees
reach maturity after about 4 years after transplantation, 6 years from the
sowing of the seed. Following transplantation, growth of dry matter is reported
to be between 4,4 and 22,2 tonnes per hectare per year, or between 2,3 and 11,1
tonnes of carbon x 44/12, or between 8 and 40 tonnes of CO2 equivalent per
hectare per year. Given the conditions under which the plant would be used in
this application, a maximum of 8 tonnes
of CO2 per hectare per year is assumed. At this rate, CDM income might be about
Euro 154 per hectare per year, or Euro 770 per hectare over the five years of
carbon build-up following transplantation. The area needed to provide 15.000
tonnes CO2, the maximum for a small-scale project under methodology AR-AMS-0005 would
therefore be about
Jatropha trees in
marginal areas with low rainfall will tend to be stunted and slow-growing.
While a typical density would be about 4m2 per plant (2500 plants per hectare),
this could be reduced to up to 9m2 (+/- 1250 plants) in arid areas. Jatropha
sown as hedges and hedgerows rather than as plantations could be planted with a
higher density. In any case, density should be such that
During the first
five years, the plants would be left to act as carbon sinks. This period may
need to be even longer in very dry conditions.
Fruit and leaves would be left in situ to serve as mulch for the soil.
After that, carbon sinks would be maintained. Leaves would be used for mulch.
Pruned material, seed cake, and husks would be recycled as biomass for
mini-briquettes for cooking purposes. Oil recovered from the seeds would be
used locally to drive equipment with motors adapted for direct use with
bio-fuels. Seed production is to the order of 2-3 tonnes per hectare. Assuming
2 tonnes of seed per hectare, inedible oil produced would be about
The purpose of
Jatropha cultivation is to set up possibilities for protected cultivation of
food crops for local consumption in marginal areas. Direct income from plant
oil should be considered a by-product. This conclusion is confirmed in the 2009
paper by Wahl N. et al, Economic
Viability of Jatropha Curcas L. Plantations in Northern Tanzania,
World Agro-Forestry Centre, Working Paper 97,
Jatropha is by no
means the only plant which can be used for protection against desertification.
For CDM financing possibilities are limited to plants qualifying as trees
within the national definitions of forests. Species such as agaves, cacti, or
panic grass (panicum turgidum) do not qualify for this purpose but they could
form useful crops for cultivation inside Jatropha hedgerows.
One species that
does qualify as an alternative is the Christ's Thorn. (Ziziphus
spina-christae) the native
area for which includes North and
The Christ’s
thorn is a thorny, erect, tree growing up to 12m. and more. The Christ’s Thorn
is a real pioneer. Its slow growth makes it unattractive to CDM projects
looking for a quick return. It is ideal for long term CDM investments for the
fight against desertification within the framework of integrated development
projects where labour costs are covered under the local money systems set up.
Where Christ’s
thorn plantations are used to create a barrier to desertification, they must be
protected against animals. This can be a problem in isolated areas far from
villages, where unattended photovoltaic fencing systems could be permanently at
risk. Water needs to be provided only during the establishment period. If this
takes place during the wet season, the need for water servicing is expected to
be limited.
Another candidate
is the Tagart bush. (Maerua crassifolia)
It is a bush or small tree that grows to a height of 2-
This is a
description taken from the Royal Botanic Gardens in Kew (UK) as published by JSTOR Plant Science :
“A
small tree to
Like the Christ’s thorn, Tagart bush plantations would need to be
protected against animals.
Rates of carbon fixation (where
known) of the Christ’s thorn, the Tagart
bush, and other pioneering plants need further study during the drafting phase
for individual projects.
The proposed
demonstration projects can be repeated as and when labour and water supplies
become available in each integrated development project area.
08.
Use of renewable biomass instead of non-renewable biomass with improved cook
stoves.
AMS 1.E Small-scale Switch from non-renewable biomass
for thermal applications by the user (Version 3) with an
accompanying clarification on the calculation of the thermal
output for applicability of small-scale limit of 45 MWth.
Integrated
development projects provide for the local production of mini-briquettes made
from renewable biomass wastes and residues supplemented as necessary by
purpose-grown renewable crops. In the proposed application renewable bio-mass
would be used for the methodology instead of manure, as has been done in the
past. This application supplements
application 01 above.
The production of
mini-briquettes for cooking stoves from recycled waste and renewable woody and
non-woody biomass within integrated development projects could fall as a new technology under methodology AMS-I-E
provided it can be shown that the 35% of renewable fuels used for the
mini-briquettes replaced non-renewable fuels and provided it can be shown that
100% renewable energy sources are used. Application 01 above already assumes
replacement of 65% of earlier fuels shown to be non-renewable. For extra CDM
funds to be made available under this application, the remaining 35% (or part
of it) must also be shown to have been non-renewable. Since it is unlikely that
100% of the fuel previously used can be shown to have been non-renewable, the
amount of compensation under this application may relate to anywhere between 0%
and 35% of the (non-renewable) fuel previously used.
By way of example, it is assumed that all 35% of the fuel replaced under this application was non-renewable, and that all fuels previously used were therefore non-renewable. In that case, 65% of 100% is replaced through the introduction of high efficiency cook-stoves under application 01, and this application refers to the switch from non-renewable to renewable of the remaining 35% of 100% of the non-renewable biomass previously consumed.
The a href="http://www.ipcc-nggip.iges.or.jp/EFDB/find_ef_main.php">website of the Intergovernmental Panel for Climate
Change (IPCC ) provides a default value for wood of 0,015 TJ [a terajoule =
joule + 12 zeros] per tonne of dry mass or 66,67 tonnes of dry mass per
terajoule.
The default
emission factor for kerosene of 71,5 tonnes of CO2 per TJ. Calculations for integrated development
projects have to be expressed in
kerosene equivalent as kerosene is the fossil fuel that would most likely be
used in the absence of wood in the project areas.
Total non-renewable wood currently used in each project area is 36500
tonnes a year.
Conversion of 35 % from
non-renewable to renewable energy sources through the use of mini-briquettes
made from renewable biomass, the amount of non-renewable wood saved would
be 12167 tonnes of wood per year.
Using a factor of 0.5 for the
conversion of wood into dry mass, 12167
tons of wood =6083.5 tonnes of dry mass.
6.083 tonnes of dry mass divided by 66,67 tonnes per TJ = 91,25, say,
91 TJ.
The default factor for kerosene is 71,5 tonnes of CO2 per terajoule.
91 TJ of dry mass x kerosene conversion factor of 71,5 tonnes of CO2 per terajoule = 6524 tons of CO2.
6524 tonnes CO2 @ Euro 14 (as at 14 November 2009) = Euro 91.337
Conclusion : Euro
6524 tonnes of CO2 is within the limit of
15.000 tons of CO2 per year for small-scale projects.
Income for each project area is dedicated to the repayment of the initial costs of the integrated development project in question. After project repayment, ongoing income is distributed equally amongst the local populations, who are all automatically members of the Local Cooperative for the on-going management and maintenance of the project structures. Poor countries do not pay registration and issuance costs. The amount is, however, subject to the deduction of DOE (designated operational entity ) verification costs. It is assumed these can be reduced to a nominal figure within the framework of a widely applicable general convention of the type foreseen.
For 2.500 projects covering the
whole of
Note : It is unlikely
that ALL biomass currently used for cooking purposes is non-renewable. The
proportion of renewable biomass
currently used must therefore be deducted from the above figures.
Definition
of renewable biomass.
Biomass
is “renewable” if it meets any one of five conditions :
05.
The bio-mass is the non-fossil
fraction of industrial or municipal waste.
By
implication, any other biomass is non-renewable.
09.
Recycling of human waste to avoid the use of industrial fertilisers.
The chosen methodology is AMS-III-Y under 3. b) mechanical solid/liquid separation through the use of urine diversion in toilets.
Saving of fertilisers through the
recycling of urine and faeces produced by 50.000 people in each
integrated development area.
The average amount recycled per
person per year is
For 50.000 people (a project
area) :
There are two types of savings. One involves
CO2 emissions savings from the manufacture of
fertiliser currently imported into each project area. The second
involves credits for avoided nitrogen oxide emissions. These are not covered
under the CDM mechanism, but can be claimed in the parallel voluntary Gold Standard label.
Here is a
possible calculation covering just the costs of manufacturing the fertiliser :
19.9 metric
tonnes of carbon = 1 TJ.
So 1 metric
tonne of carbon = 0,0502512 TJ
Nitrogen =
78,230,000 joules per kg = 78,230,000,000 joules per tonne = 0.07823 TJ/tonne
Phosphorus =
17,500,000 joules per kg = 17,500.000,000 joules per tonne = 0.0175 TJ/tonne
Potassium =
13,800,000 joules per kg = 13,800,000,000 joules per tonne = 0,0138 TJ/tonne.
Each
integrated development project saves :
285 tonnes
nitrogen = 4.9875 TJ
30 tonnes
phosphorus = 0,525 TJ
60 tonnes
potassium = 0.828 TJ
Total :
6.3405 TJ .
6.3405 TJ/
0,0502512 TJ = 126,17609 metric tonnes of carbon equivalent.
Conversion
rate Carbon to carbon dioxide equivalent 3,67
126,17609
metric tonnes of carbon = 463 tonnes CO2.
463 tonnes
CO2 @ about Euro 14 per tonne (on 14th
November 2009) = Euro 6.691.
Euro 6.691 over
21 years produces Euro 140.511.
The issue of
nitrogen emissions is handled in the estimation of direct nitrous
oxide emission from nitrogen fertilization. CDM Executive Board,
UNFCCC United Nations Council for Climate Change, Report of the 33rd meeting,
Use of 285
tons of nitrogen assuming the volatile
part is all given off as N2O the carbon dioxide equivalent given
to the atmosphere as N20 would be 285 tons x (1-0.1) x 0.01
emission factor x 1.571 molecular weight x 310 global warming
factor = 1249 tons CO2 equivalent put into the atmosphere by the
fertiliser application.
1249 tonnes of CO2 equivalent at Euro 14 per tonne (14th
November 2009) = Euro 17.486 per year.
Over 21 years the total amount would be Euro 367.206
The total amount
recovered under the CDM and the Gold
Standard together would be Euro 507.717.
The amount recoverable for 2500 projects
in
Income for each project area is dedicated to the repayment of the initial costs of the integrated development project in question. After project repayment, ongoing income is distributed equally amongst the local populations, who are all automatically members of the Local Cooperative for the on-going management and maintenance of the project structures. Poor countries do not pay registration and issuance costs. The amount is, however, subject to the deduction of DOE (designated operational entity ) verification costs. It is assumed these can be reduced to a nominal figure within the framework of a widely applicable general convention of the type foreseen.
10.
Methane recovery from animal waste for cooking and lighting purposes especially
in pastoralist areas.
Small-scale methane recovery from animal waste for
lighting purposes and electricity generation in pastoralist areas.
The new methodology
AMS-III-AR (introduced 26th November, 2010) (from 26th November 2010) included
under application 11 below applies to the adoption of LED lamps. It refers to
the lighting technology itself. The use of renewable bio-mass instead of
non-renewable biomass for use with improved cook stoves is covered under
application 8 using methodology AMS 1.E Small-scale Switch from non-renewable biomass
for thermal applications by the user (Version 3).
AMS-III-R with AMS-I-C can be used
for methane recovery under this application 10. Since this application
10 partly doubles up with applications 8
and 11, double counting must be carefully avoided. CDM system does not recognise
methane savings, which are 21 times “heavier” than CO2. AMS-I-A (Version 14) is based on the calculation of the CO2 saved
by the new system compared with the earlier system.
The
challenge is to find alternative existing uses of non-renewable energy within
each integrated development area. Beneficiaries
may also choose to use the gas for new energy uses, but this would not
qualify for CDM funding. They may prefer to use their methane gas to replace
the mini-briquettes for stoves under application 01 above. This too would,
however, lead to a drainage of possible CDM resources. They could also
substitute the use of methodology AMS-I-A (Version 14) under application 12 by using methane to
replace non-renewable electrical, diesel- and battery-driven sources for
mechanical equipment such as pumps and mills and, where applicable, pubic
lighting systems. Formal requirements for AMS-III-R are
simpler than those for AMS-I-A.
Since most
existing energy uses are covered under other applications, it is difficult to
make widely applicable hypotheses for activities under this application. The
average CDM value is therefore deemed to be zero for the purposes of CDM income
calculations .
introduced 26th November, 2010), which applies to the
adoption of LED lamps, appears to be the best methodology. It is coupled to
energy savings inherent in the introduction of lighting technology, not to the source of energy. The highest
energy savings with the greatest flexibility of use are given by the adoption
of LED lights. The substantially higher initial investment cost of LED lamps is
directly recovered by the reduction in the size of the alternative energy power
source installed.
This methodology is applicable only to project
lamps whose batteries are charged using one of the following options :
(a) Charged
by renewable energy system (e.g. photovoltaic systems or mechanical systems
such as wind battery chargers);
(b)
Charged by a standalone distributed generation system (e.g. a diesel
generator set) or a mini-grid
(c)
Charged by a grid that is connected to regional/national grid.
The technical solutions adopted will
vary from one integrated development project to another.
Baseline emissions are calculated per equation (2).
BEy = DV ×GFy × DBy
Where:
BEy Baseline Emissions per project lamp in year y (tCO2e)
DV Default Emissions Factor (0.08 tCO2e per project
lamp calculated using values indicated in paragraph 12)
GFy Grid Factor in year y, Equal to 1.0 when charging option
11.
Replacement of kerosene lamps, incandescent light bulbs, and of the use of
throw-away batteries by renewable energy sources (wind, solar and/or renewable
bio-mass including but not limited to plant oil, gasification of biomass).
Replacement
of kerosene lamps and of the use of throw-away batteries by renewable energy
sources (wind, solar and/or renewable bio-mass including but not limited to
plant oil, gasification of biomass). Methodology AMS-III-AR (defined in paragraph 2(a) is used; 10
• Equal to
1.0 if the project activity is for off grid households/communities 10 (defined
as no grid access or less than 12 hours grid availability per day on an annual
average basis);
• Otherwise
it is equal to (1- fraction of time grid is available to the target households
and communities/users in the region of project activity)
DBy Dynamic Baseline Factor (change in baseline fuel,
fuel use rate, and/or utilization during crediting period) in year y.
Calculated as either:
Option 1: default of
Option 2: value of 1.0+FFg where FFg is the
documented national growth rate of kerosene fuel use in lighting from the
preceding years (use the most recent available data of three or five years
average (fraction)
The emissions from the LED lamps are subtracted from those caused by the
kerosene lamps (or equivalent) replaced.
The Methodology defaults to 1 kerosene lamp per household, used for 3.5
hours a day, 365 days a year, with a fuel use rate of
For the purposes of the calculation, the default emissions factor is
taken as 0.08 tCO2 e per project lamp
Assuming emissions attributed to LED lamps is 5% of that of kerosene lamps 822 tons x 95% = 780
tonnes.
Control :
The given default emissions figure for existing fuel is
767,4 tonnes @ about Euro 14 (on 14th November 2009) = Euro
10,744 per year.
Euro 10,744 per year x Euro 225,624.
12.
Replacement of non-renewable electrical, diesel- and battery-driven sources for
mechanical equipment such as pumps and mills and, where applicable, pubic
lighting systems.
The
chosen methodology
AMS-I-A has already been used for applications relating to
both wind and solar energy and to biomass applications for electricity
generation including but not limited to palm oil and manures using stand-alone
mini-grids with installed capacity less than 15MW or individual structures each
with emissions reductions less than 5 tonnes of CO2e per year.
Replacement of
kerosene lamps by LED lamps has been covered under application 11 above.
This application
can be selectively used for the following and other purposes :
a)
b) A mini-grid to
support existing lighting and cooling facilities for local commercial activities.
c) Renewable
energy operation of existing diesel-driven equipment such as water pumps and
mills.
It is not clear
how solar-powered battery chargers for rechargeable radio and torch batteries
could be included in this application as the CDM system applies only to CO2
savings, and not to non-rechargeable batteries and the environmental aspects
relating to their loss in the environment.
The text of the
methodology reads:
“This category comprises renewable electricity
generation units that supply individual households/users or groups of
households/users included in the project boundary. The applicability is limited
to individual households and users that do not have a grid connection except
when;
“(a) A group of households or users
are supplied electricity through a standalone mini-grid powered by renewable
energy generation unit(s) where the capacity of the generating units does not
exceed 15 MW (i.e., the sum of installed capacities of all renewable energy
generators connected to the mini-grid is less than 15 MW) e.g., a community
based stand-alone off-the-grid renewable electricity systems; or
“(b) The emissions reduction per
renewable energy based lighting system is less than 5 tonnes of CO2e a year and
where it can be shown that fossil fuel would have been used in the absence of
the project activity by;
(i) A representative sample survey
(90% confidence interval, ±10% error margin) of target households; or
(ii) Official statistics from the
host country government agencies.”
“The renewable energy generation
units include technologies such as solar, hydro, wind, biomass gasification and
other technologies that produce electricity all of which is used
on-site/locally by the user, e.g., solar home systems, wind battery chargers .
The renewable generating units may be new installations (
Urban integrated
development project areas are likely to have a greater use for this application
than rural ones, which are usually so poorly served that there are few existing
structures. It is assumed here that project areas are poorly equipped with
commercial and industrial equipment. The following hypothetical examples are
therefore conservative.
Integrated development project areas contain about 45 intermediate level
administrative units each serving about 1.500 people, and about 250 local
administrative units each typically serving about 250 people.
a) Street lighting. Suppose each local administrative units has, on an
average, 2 street lights and that each light burns
b) Lighting
appliances for commercial activities. Suppose each local administrative units has, on an average, five
families out of 50 each using 2 lights for commercial purposes and that each
light burns
There are about
250 local administrative units in each integrated development project area.
Each integrated development project area would therefore use 250 x
c) Cooling
appliances for commercial activities. Suppose each intermediate administrative unit has, on an average, one
commercial activity using a refrigerator-cooler-freezer with a consumption of
0.25 kw/hour or 6 kWh/day. There are about
45 intermediate administrative units in each integrated development project
area. Each integrated development project area would therefore use 6 x 45 kWh or 270 kWh per day. 270 kWh per day x 365
= 98.550 kWh per year.
1 terajoule =
about 277.778 kWh. So 98.550 kWh = about 0.35 TJ.
The default factor for diesel is about 74 tonnes of CO2 per terajoule.
Diesel equivalent consumed by refrigerators/freezers is 74 x 0.35 =
about 26 tonnes of CO2.
26 tonnes of CO2 @ about Euro 14 (14th November 2009) = Euro 364 per
year.
d) Replacement of
diesel-driven milling and pumping equipment. Suppose each intermediate administrative unit
has, on an average, one commercial activity using a diesel-driven motor with a
rated power of 10 hp (about 7.5 kW) operating over 10 hours per day. 10 hours
at 7.5 kW = 75 kWh.
There are about
45 intermediate administrative units in each integrated development project
area. Each integrated development project area would therefore use 45 x 75 kWh or 3.375 kWh per day. 3.375 kWh per day x
365 = 1.231.875 kWh per year.
1 terajoule =
about 277.778 kWh. So 1.231.875 kWh = about 4.43 TJ.
The default factor for diesel is about 74 tonnes of CO2 per terajoule.
Diesel equivalent consumed by refrigerators/freezers is 74 x 4.43 =
about 327.82 tonnes of CO2.
327.82 tonnes of CO2 @ about Euro 14 (14th November 2009) = about Euro
4.590 per year.
The typical accumulative CO2 savings
in each integrated development project area under application 12 might
therefore be to the order of Euro 24.000 per year (totals a) +b)+c)+d)) , or
Euro 506.557 over 21 years. This
amount is, however, subject to the deduction of DOE (designated operational
entity ) verification costs. It is assumed these can be reduced to a nominal
figure within the framework of a widely applicable general convention of the
type foreseen.
Although the total is low and the expected verification costs relatively high, the amount can still cover up to 10% of the formal money costs of an integrated development project.
CO2 savings would be higher where
projects are carried out in poor urban areas.
13.
Local recycling and recovery of materials from solid wastes, including but not
limited to plastics.
Small scale local recycling and recovery of materials from solid wastes,
including but not limited to plastics, is a feature of integrated development
projects. The quantities involved in any given integrated development project
area may often be too small to justify an application under the CDM system. On
the hand, projects in poor urban areas and in areas close to larger urban
centres may wish to profit from labour intensive recycling of waste materials
coming from the urban centres. Any recycling
activity with a relatively high labour content may be suitable for this
application.
Recovery and recycling of plastics
materials is covered under methodology AMS-III-AJ. The
methodology can be adapted for use with non-hazardous materials including glass, paper, metals, eventually used
batteries, etc. as well as for plastics. The CO2 savings are
calculated by subtracting the energy used in the recycling process from the
energy used to produce equivalent new material. The products being recycled
must either have been manufactured in the host country or use raw materials
(resins) imported from a non-industrialised (that is, a non-annex 1) country.
Materials to be recycled can be obtained in a radius of
It is difficult
to make widely applicable hypotheses for activities under this application. The
average CDM value is therefore deemed to be zero for the purposes of indicative
CDM income calculations.
SECTION 09. GRAPHS AND CONCLUSIONS.
The initial
financial requirements of respectively Euro 3.750.000 (non-pastoralist areas)
and Euro 5.600.000 (pastoralist areas) must be deposited up-front to cover
project execution over the two-year period foreseen for that purpose. This
initial capital can be reimbursed over the following years through funds
provided by the sale of certified emission reduction (CER) units issued under
the Clean Development Mechanism (CDM) system set up under the Kyoto
Protocol.
This is possible
through the application of batches of small-scale Clean Development Mechanisms
(CDM) methodologies common to all individual integrated development projects
and based on Programmes of Activities (PoA) organised in two layers.
The first level
Programme of Activities (PoA) is the mother PoA. For the integrated development
of, say, West Africa (excluding
The second level
comprises a batch of 13 Programmes of Activities (PoAs) each using a specific
CDM methodology. Each of the 2500 individual integrated projects may choose to
apply any one, any combination, or all of the 13 second level PoAs in
accordance with the local requirements there. For instance, one project area
may apply methodology AR AMS-003, Version 1 for the reforestation of wetlands, another may
choose to apply AR-AMS-0005 (Version 2, 8
April 2009) in an area with low inherent potential to support living
biomass, while a third project area with both wet and very dry areas may choose
to apply both methodologies.
There are two main sectors for intervention under the
CDM mechanism. The first one is CDM funding through reduction of CO2 emissions
in project areas through the use of improved cooking stoves, more efficient
lighting systems and switches from non-renewable biomass to renewable biomass
and similar. The second one is CDM funding through increase of CO2 sinks
through various afforestation and reforestation projects.
A preliminary analysis shows that
the potential total average gross CDM income over 50 years for each integrated
development project could be Euro 26.315.233. This
is a cautious non-scientific initial approximation.
It is subject to the deduction of at least 10% to cover
administration and validation costs. It is expressed in present day Euros and
based on CO2/tonne values on 14th November 2009 (about € 14 per
tonne CO2). It is, therefore, not discounted over 10-20 year periods according
to traditional cost-benefit calculation practices. It assumes annual validation
by the CDM Designated Operational Entity (DOE), while various CDM methodologies
currently prescribe different validation periods. It also assumes enough water
and labour is available to start the various afforestation/reforestation
projects more or less contemporaneously. If this is not so, they may need to be
phased.
A first level (mother) PoA with
2.500 applications representing 2.500 individual integrated development project
areas (125.000.000 people) could generate up to € 65.788.082.000 of CDM
funding. This would eliminate poverty in the areas concerned and surpass all of
the millennium development goals there except those relating to vaccinations
and curative medecines.
Click here to view a general graph showing annual distribution of expected
gross CDM income for each individual integrated development project area .
The graph is intended to show
that, whatever happens and however the calculations are made, each individual
integrated development project can repay its initial capital cost investments over just a few years of
operation.
The first lot of gross CDM income,
which is attributable to the second year of activities, is Euro 542.886. This
could mature for sale of CER units at the end of the third year. The
second lot of gross CDM income, which is attributable to the third
year of activities, is Euro 1.285.393. This could mature for sale of CER units
at the end of the fourth year. The third
lot of gross CDM income, which is attributable to the fourth year of
activities, is Euro 1.633.500. This could mature for payment at the end of the
fifth year. The fourth instalment of gross CDM income, which is attributable to
the fifth year of activities, is Euro 1.601.678. This could mature for payment
at the end of the sixth year. The fifth instalment of gross CDM income, which
is attributable to the sixth year of activities, is Euro 1.251.678 which would
mature for payment at the end of the seventh year. … and so on. Only application 02
(afforesttion/reforestation of natural reserves) and 03 (settlements, afforestation/reforestation
first part) extend beyond 21 years.
Application 06, Mangroves for wetlands, would extend for 30 years but is
not included in the indicative baseline calculation.
Indicative incomes are gross of
DOE validation and administration costs. An allowance of at least 10% should
therefore be made to cover these costs. So the net figures from the
preceding paragraph are :
Total expected net CDM income per
project Euro 23.683.709.
Expected net CDM income relative
to second year Euro 488.597.
Expected net CDM income relative
to third year Euro 1.156.854.
Expected net CDM income relative
to fourth year Euro 1.497.150
Expected net CDM income relative
to fifth year Euro 1.441.510
Expected net CDM income relative
to sixth year Euro 1.126.510
These indicative CDM incomes are
subject to substantial change where, because of limitations in water supply
and/or labour, activities have to be phased in. In that case the general total
does not change, but the rate of repayment would be lower and the repayment
spread over a longer period.
Not all of the
potential CDM funding capacity has been absorbed. It has been assumed that more
projects will use application 07 AR-AMS-0005 (Version 2, 8
April 2009) for very dry
areas with Jatropha, than application AR AMS-003, Version 1 for
wetlands with mangroves, which give a much higher CDM return. Use of methodology
AMS-III-AR for methane recovery has been rated at zero until
advice on the energy applications it could replace is received. The use of
methodology AMS-III-AJ for the
recycling of plastics and other materials has been rated at zero until
information on the quantities of materials typically available for recycling is
received. This aspect is discussed in
more detail in section 01. Introduction.
How rapidly the initial capital input of integrated
development projects is repaid is a political issue. A regional
project owner such as the UEMOA may make a call on 100% of CDM funds as they
come in, or may accept for example of repayment of 50%, allowing the remaining
50% to be distributed amongst the populations in the project areas or any other
combination of the two. Partial distribution of funds to the populations
provide them encouragement and a great stimulus. Rapid re-entry of funds on the
other hand provides revolving finance for new integrated development projects
and more rapid execution of all projects included in the regional development
plan in question.
Subject to the
above comments, expected net CDM incomes projects in non-pastoralist areas with
an initial capital input of Euro 3.750.000 would in principle enable repayment
of the initial capital input fully repaid during the sixth year of activities, on the basis
of CDM income from the first five years. In non-pastoralist areas with an
initial capital input of Euro 5.600.000 the initial capital input could in
principle be fully repaid at the end of the seventh
year of activities, on the basis of CDM income from the first six years.
Once the initial
capital for a given integrated development project has been repaid, all
remaining CDM income is paid from time to time to the project’s Cooperative for
the On-going Administration of the Project Structures (of which all adults in
the project area are members) and either equally distributed amongst the
members or used to cover extensions to project structures.
The full amount of the initial project capital
necessary for the execution of each integrated development project must always be paid up front.
The proposed
programme of CDM applications provides many major benefits to the local
populations as well as funds to pay for their integrated development projects.
Food safety is greatly increased through the supply of fruit and nuts and
hedgerows for protecting crops in semi-arid and arid areas. The bamboo
plantations provide food in the form of bamboo shoots, material for uncountable
productive activities, and biomass for the production of mini-briquettes for
cooking purposes. Moringa trees provide “spinach leaves” for food, edible oils
for cooking, and moringa paste for water purification purposes. The Jatropha
produces limited amounts of bio-fuel to drive local generators and equipment.
All CDM activities improve the quality of the environment and maintain
bio-diversity. All these benefits are all in addition to those already listed
in the report on costs and benefits which is part of the Model for Integrated
Development Projects.
Graphs:
Graphs showing details of the
expected gross CDM income application by application for the second year of operation, the third year of operation, the fourth year of operation, the fifth year of operation, the sixth year of operation, the seventh year of operation, the eighth year of operation and the ninth year of operation. Similar
graphs for other years can be supplied on request.
Graphs showing
expected gross CDM income year by year for application 01. CO2
savings through the reduced use of non-renewable biomass for cooking
purposes through the introduction of improved stoves (methodology AMS-II-G.(Version 2)),
application 02. Demonstration project for
the recovery of forest lands and natural parks and reserves using
traditional species (methodology AR-AMS-0004 version 2, 11 June, 2009 ) ; application 03 Afforestation activities in
settlements as defined for the
distributed planting of fruit trees and nut trees and similar, ( Methodology AR-AMS-2 (version 2, 17 October 2008);
application 04. Small-scale agro-forestry activities – such as
distributed bamboo plantations on grasslands and croplands
(Methodology AR-AMS-0001);
application 05 Small-scale agro-forestry activities – distributed
demonstration plantations for practical purposes for local use, including but
not limited to Moringa plantations on marginal lands (Methodology AR-AMS-0004 , version 2, 11
June, 2009);application 06.
Demonstration afforestation and/or reforestation (AR) projects on wetlands
using traditional species (Methodology AR AMS-003, Version 1),application
07
Demonstration afforestation and/or reforestation projects using Jatropha
on lands having low inherent potential to support living biomass (Methodology AR-AMS-0005 (Version 2, 8
April 2009), application 08. Use of renewable biomass instead of non-renewable
biomass with improved cook stoves (Methodology AMS 1.E Small-scale Switch from non-renewable biomass
for thermal applications by the user), application 09, Recycling of human waste to avoid the
use of industrial fertilisers (Methodology AMS-III-Y );
application 10 : Methane recovery from animal waste for cooking and lighting
purposes especially in pastoralist areas (Methodology AMS-III-AR );
application 11. Replacement of kerosene
lamps, incandescent light bulbs, and of the use of throw-away
batteries by renewable energy sources (wind, solar and/or renewable bio-mass
including but not limited to plant oil, gasification of biomass (Methodology AMS-III-AR);
application 12. Replacement of
non-renewable electrical, diesel- and battery-driven sources for
mechanical equipment such as pumps and mills and, where applicable, pubic
lighting systems (methodology
AMS-I-A); and 13. Local recycling and recovery of materials
from solid wastes, including but not limited to plastics (methodology AMS-III-AJ.)
Graphs showing details of the
expected gross CDM income for each of the first nine years of project operation
, as well as those for each of the various applications foreseen ,are available
in Section 09 below.
Table 1 shows the plan of Mother
PoA and sub-PoAs. For the development of
Table 1 : The two
Programme of Activities (PoA) levels.
|
Year of operation |
Sub-PoA |
01 |
02 |
03 |
04 |
05 |
06 |
07 |
08 |
09 |
10 |
11 |
12 |
13 |
14 |
15 |
16 |
17 |
18 |
19 |
20 |
21 |
22 |
|
Mother PoA |
01.
CO2 savings reduced use of non-renewable biomass for cooking purposes through
the introduction of improved stoves. AMS-II-G.(Version 2) (50 years) |
|
x |
x |
x |
x |
x |
x |
x |
x |
x |
x |
x |
x |
x |
x |
x |
x |
x |
x |
x |
x |
x |
|
02.
Demonstration projects for the recovery of forest lands and natural parks and
reserves. AR-AMS-0004 , version
2. (50 years) |
|
x |
x |
x |
x |
x |
x |
x |
x |
x |
x |
x |
x |
x |
x |
x |
x |
x |
x |
x |
x |
x |
|
|
03.
Afforestation activities in settlements as defined Distributed planting of fruit and nut trees
and similar. AR-AMS-2 (version 2) |
|
x |
x |
x |
x |
x |
x |
x |
x |
x |
x |
x |
x |
x |
x |
x |
x |
x |
x |
x |
x |
x |
|
|
04.
Small-scale agro-forestry activities – such as distributed bamboo plantations
on grasslands and croplands. AR-AMS-0001 |
|
x |
x |
x |
x |
x |
x |
x |
|
|
|
|
|
|
|
|
|
|
|
|
|
|
|
|
05
Small-scale agro-forestry activities – distributed demonstration Moringa
plantations on marginal lands, AR-AMS-0004 , version
2. |
|
x |
x |
x |
x |
|
|
|
|
|
|
|
|
|
|
|
|
|
|
|
|
|
|
|
06.
Demonstration afforestation and/or reforestation (AR) projects on wetlands
using traditional species. AR AMS-003, Version 1. (30 years) |
|
x |
x |
x |
x |
x |
x |
x |
x |
x |
x |
x |
x |
x |
x |
x |
x |
x |
x |
x |
x |
x |
|
|
07 Demonstration Jatropha projects on lands
having low inherent potential to support living biomass. AR-AMS-0005 (Version 2, 8
April 2009) |
|
x |
x |
x |
x |
x |
x |
x |
|
|
|
|
|
|
|
|
|
|
|
|
|
|
|
|
08.
Use of renewable biomass instead of non-renewable biomass with improved cook
stoves. AMS 1.E . |
|
x |
x |
x |
x |
x |
x |
x |
x |
x |
x |
x |
x |
x |
x |
x |
x |
x |
x |
x |
x |
x |
|
|
09. Recycling
of human waste to avoid the use of industrial fertilisers AMS-III-Y |
|
x |
x |
x |
x |
x |
x |
x |
x |
x |
x |
x |
x |
x |
x |
x |
x |
x |
x |
x |
x |
x |
|
|
10.
Methane recovery from animal waste for cooking and lighting purposes
especially in pastoralist areas. AMS-III-AR
(Reserve pending
applications) |
|
|
|
|
|
|
|
|
|
|
|
|
|
|
|
|
|
|
|
|
|
|
|
|
11. Replacement
of kerosene lamps etc (wind, solar and/or renewable bio-mass including plant
oil, gasification of biomass). Methodology AMS-III-AR |
|
x |
x |
x |
x |
x |
x |
x |
x |
x |
x |
x |
x |
x |
x |
x |
x |
x |
x |
x |
x |
x |
|
|
12.
Replacement of non-renewable electrical, diesel- and battery-driven sources
for mechanical equipment AMS-I-A |
|
x |
x |
x |
x |
x |
x |
x |
x |
x |
x |
x |
x |
x |
x |
x |
x |
x |
x |
x |
x |
x |
|
|
13. Local
recycling and recovery of materials from solid wastes, including but not
limited to plastics. AMS-III-AJ.
(Reserve pending applications) |
|
|
|
|
|
|
|
|
|
|
|
|
|
|
|
|
|
|
|
|
|
|
◄ Eighth block
: Section 3 : Costs and benefits analysis.
◄ Main index for
the Diploma in Integrated
Development (Dip. Int. Dev.)